Sentry
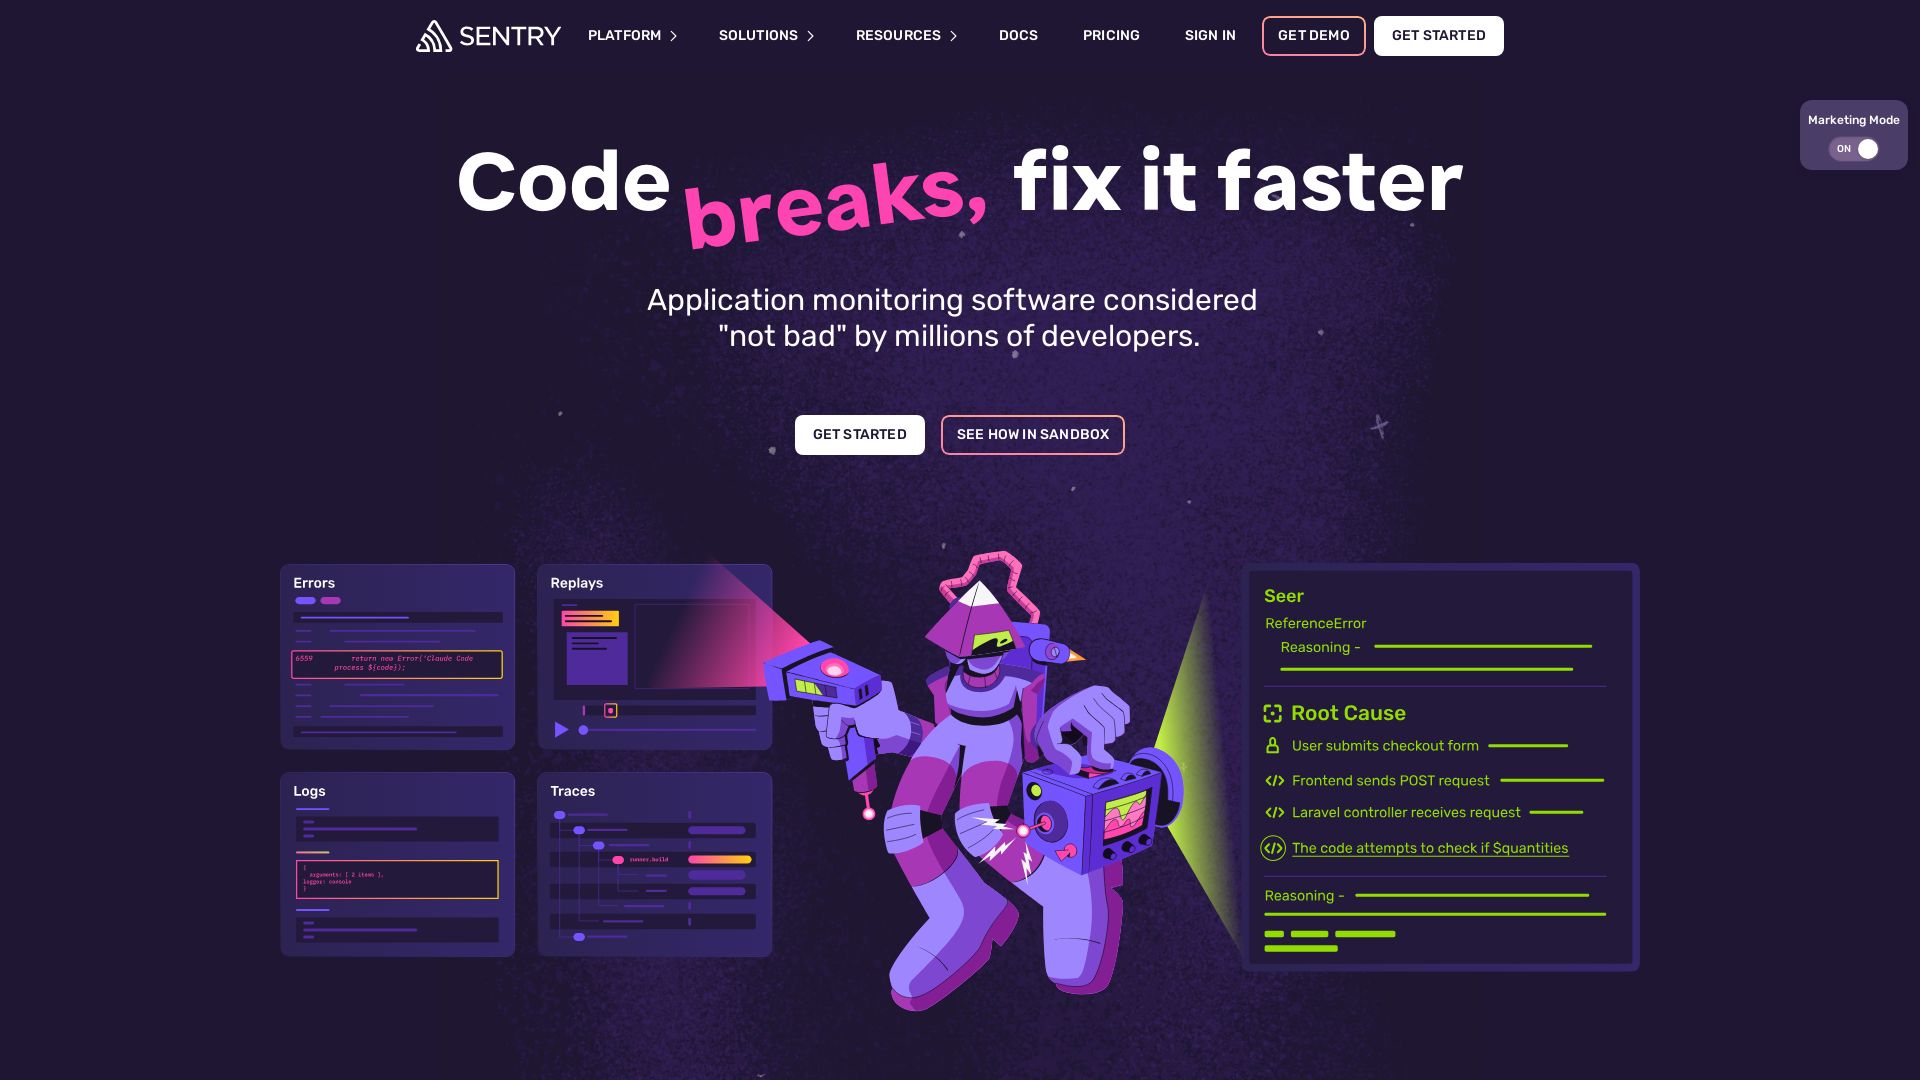
Fix code faster with Sentry's AI-powered debugging, error monitoring, and tracing. Get started in 5 lines. Loved by millions.
Editor's Verdict
Key Takeaways
- Monitor in Five Lines
- Automatic Root-Cause Analysis
- AI Code Review
- Unified Observability
In-Depth Review: What is Sentry?
Sentry is the only application monitoring platform that empowers developers to fix issues without compromising velocity. With just five lines of code, you get automatic root-cause analysis via Seer, our AI debugger, and a fully connected experience of errors, logs, replays, traces, profiles, and metrics. Catch regressions before they ship, debug in your workflow, and stay secure. Trusted by teams at Disney, Atlassian, and Anthropic.
Core Features
Monitor in Five Lines
Drop in the SDK with just a few lines of code, no agents to install, and no performance surprises.
Automatic Root-Cause Analysis
Catch critical issues before merge and fix them in production with Seer, the AI debugging agent and code reviewer.
AI Code Review
Predict and prevent errors before they reach production using AI code review.
Unified Observability
Connect errors, logs, replays, spans, profiles, and metrics in a single trace for full context.
Seer AI Debugger
AI debugger that uses logs, commits, traces, and stack traces to explain failures and generate merge-ready patches.
Session Replay
Replay fetch() failures and user sessions to debug issues from dev to production.
Performance Monitoring
Trace slow queries, N+1s, and request timeouts with distributed tracing.
Integrations
Native integrations with GitHub, Slack, Jira, Linear, and coding agents via MCP server.
Secure by Design
Built with SOC2, HIPAA, ISO 27001 compliance, data residency, and PII management.
Pricing
Developer
- One user
- 5,000 errors
- Error Monitoring and Tracing
- Alerts via email
- 10 custom dashboards
- 5GB Logs
- 5GB Application Metrics
- 5M spans
- 50 replays
- 1 uptime monitor
- 1 cron monitor
- 20 metric monitors
- 1GB attachments
- 100 size analysis builds
Team
- Unlimited users
- 50,000 errors
- Third-party integrations
- 20 custom dashboards
- Seer AI debugging agent (subscription required)
- 5GB Logs (+$0.50/GB additional)
- 5GB Application Metrics (+$0.50/GB additional)
- 5M spans
- 50 replays
- 1 uptime monitor (+$1.00/uptime alert additional)
- 1 cron monitor (+$0.78/monitor additional)
- 20 metric monitors
- 1GB attachments
- 100 size analysis builds
- Email support
Business
- Unlimited users
- 50,000 errors
- Unlimited custom dashboards
- Unlimited metric monitors with anomaly detection
- Advanced quota management
- SAML + SCIM support
- 5GB Logs (+$0.50/GB additional)
- 5GB Application Metrics (+$0.50/GB additional)
- 5M spans
- 50 replays
- 1 uptime monitor (+$1.00/uptime alert additional)
- 1 cron monitor (+$0.78/monitor additional)
- 1GB attachments
- 100 size analysis builds
- Up to 90-day data retention
- Anomaly detection
Enterprise
- Business features plus
- Technical account manager
- Dedicated customer support
- Custom quotas
- Custom data retention
- BAA and HIPAA security
- Data residency options
Pros and Cons
Pros
- Easy SetupGet started with just one command or five lines of code, no agents required.
- AI-Powered DebuggingSeer AI automatically root-causes issues and generates fix patches, saving development time.
- All-in-One ObservabilityUnifies errors, logs, traces, replays, and metrics in a single platform.
- Strong IntegrationsWorks seamlessly with GitHub, Slack, Jira, Linear, and coding agents.
- Enterprise SecurityCompliant with SOC2, HIPAA, ISO 27001, and offers data residency options.
Cons
- Cost at ScalePay-as-you-go rates for overages can become expensive for high-volume applications.
- Limited Free TierFree plan restricts to 5,000 errors and 50 replays, insufficient for production apps.
- Learning CurveAdvanced features like custom sampling and integrations may require time to learn.
- Dependency on CloudSentry is a SaaS platform; on-premise options require additional setup (Relay).
- AI Features Extra CostSeer AI debugging requires an additional subscription, not included in base plans.
Use Cases & Recommended Professions
Software Engineer→ View Toolkit
Needs to quickly debug and fix code errors in production without slowing down development velocity.
DevOps Engineer→ View Toolkit
Requires comprehensive monitoring and alerting to ensure application reliability and performance.
QA Engineer→ View Toolkit
Uses Sentry to track issues, replay sessions, and verify fixes before release.
Full-Stack Developer→ View Toolkit
Benefits from unified observability across frontend and backend to resolve issues faster.
Site Reliability Engineer (SRE)→ View Toolkit
Leverages traces, metrics, and alerts to maintain SLAs and reduce incident response time.
Engineering Manager→ View Toolkit
Uses Sentry's dashboards and code ownership to monitor team performance and release quality.
Frequently Asked Questions
Alternative AI Tools
View Detailed Comparison →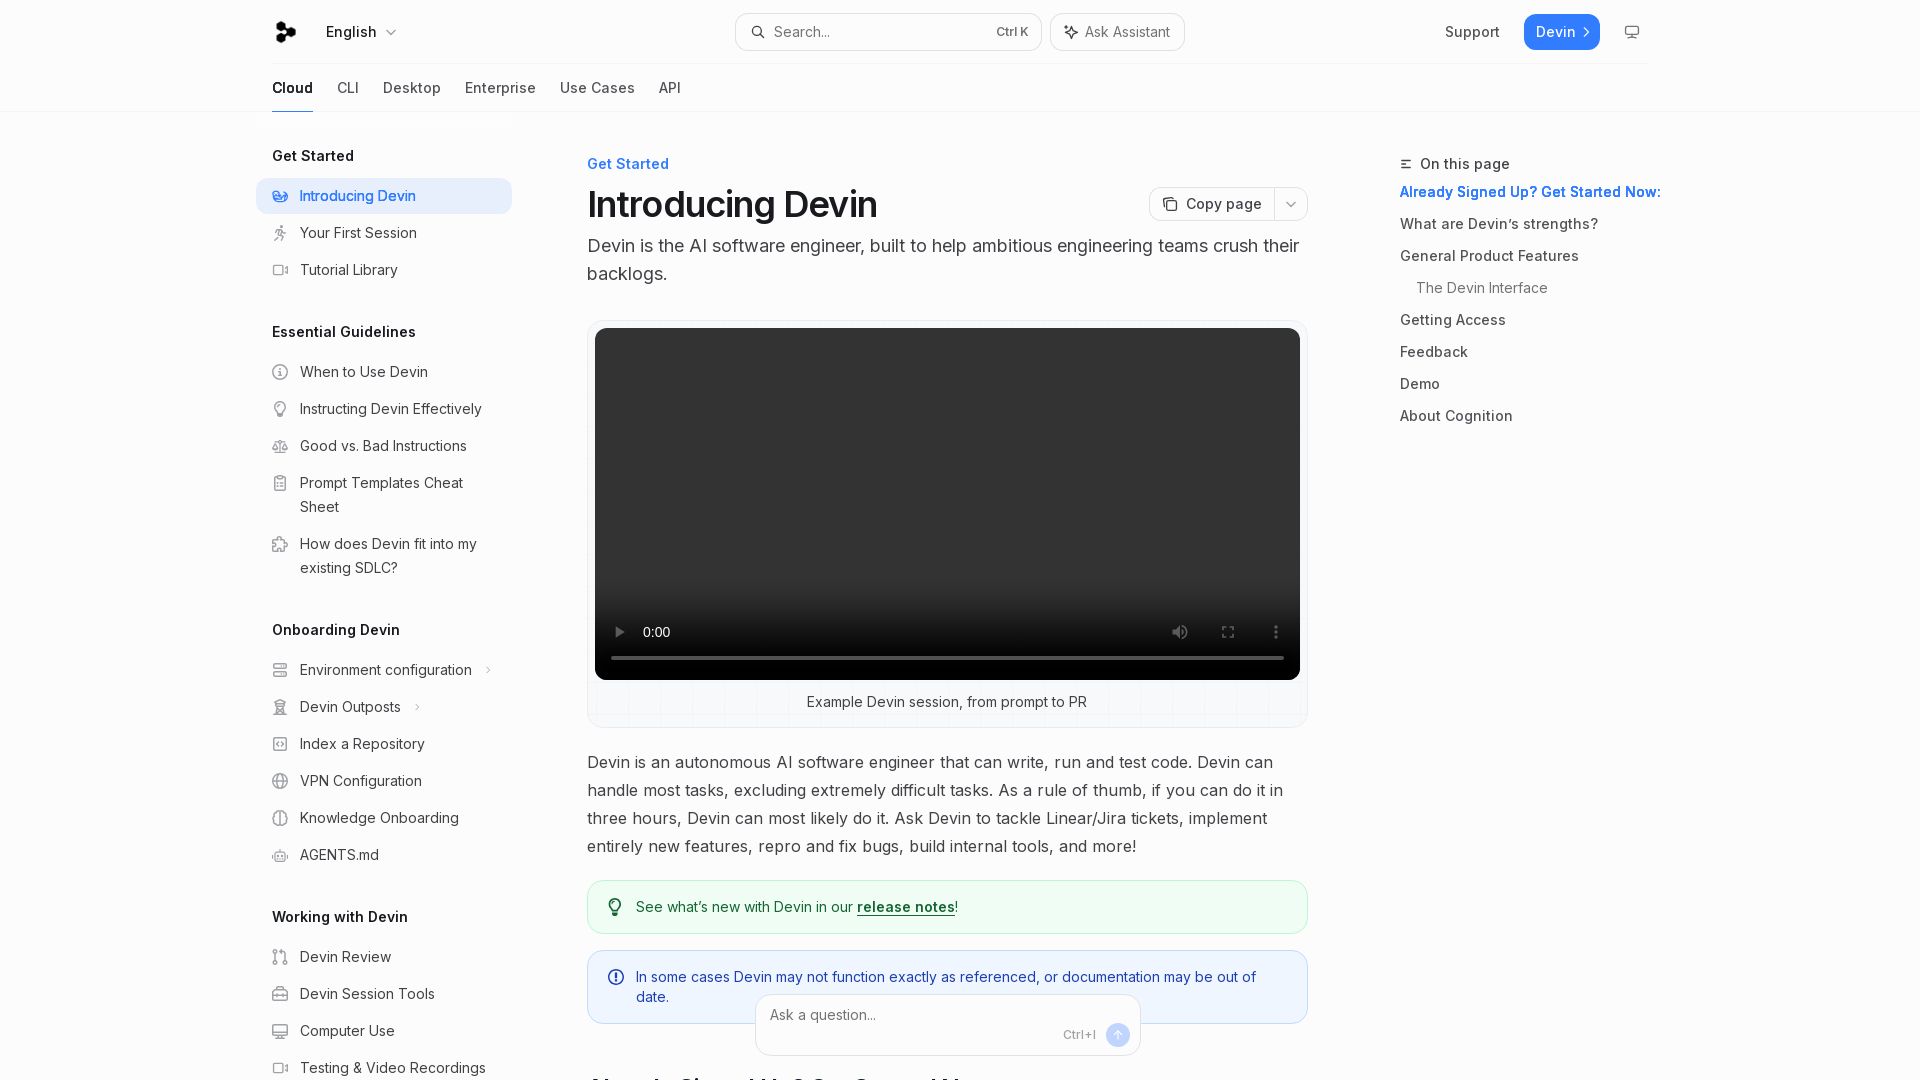
Devin
Devin is an autonomous AI software engineer that writes, runs, and tests code. Automate coding tasks, fix bugs, and crush backlogs.

OpenObserve
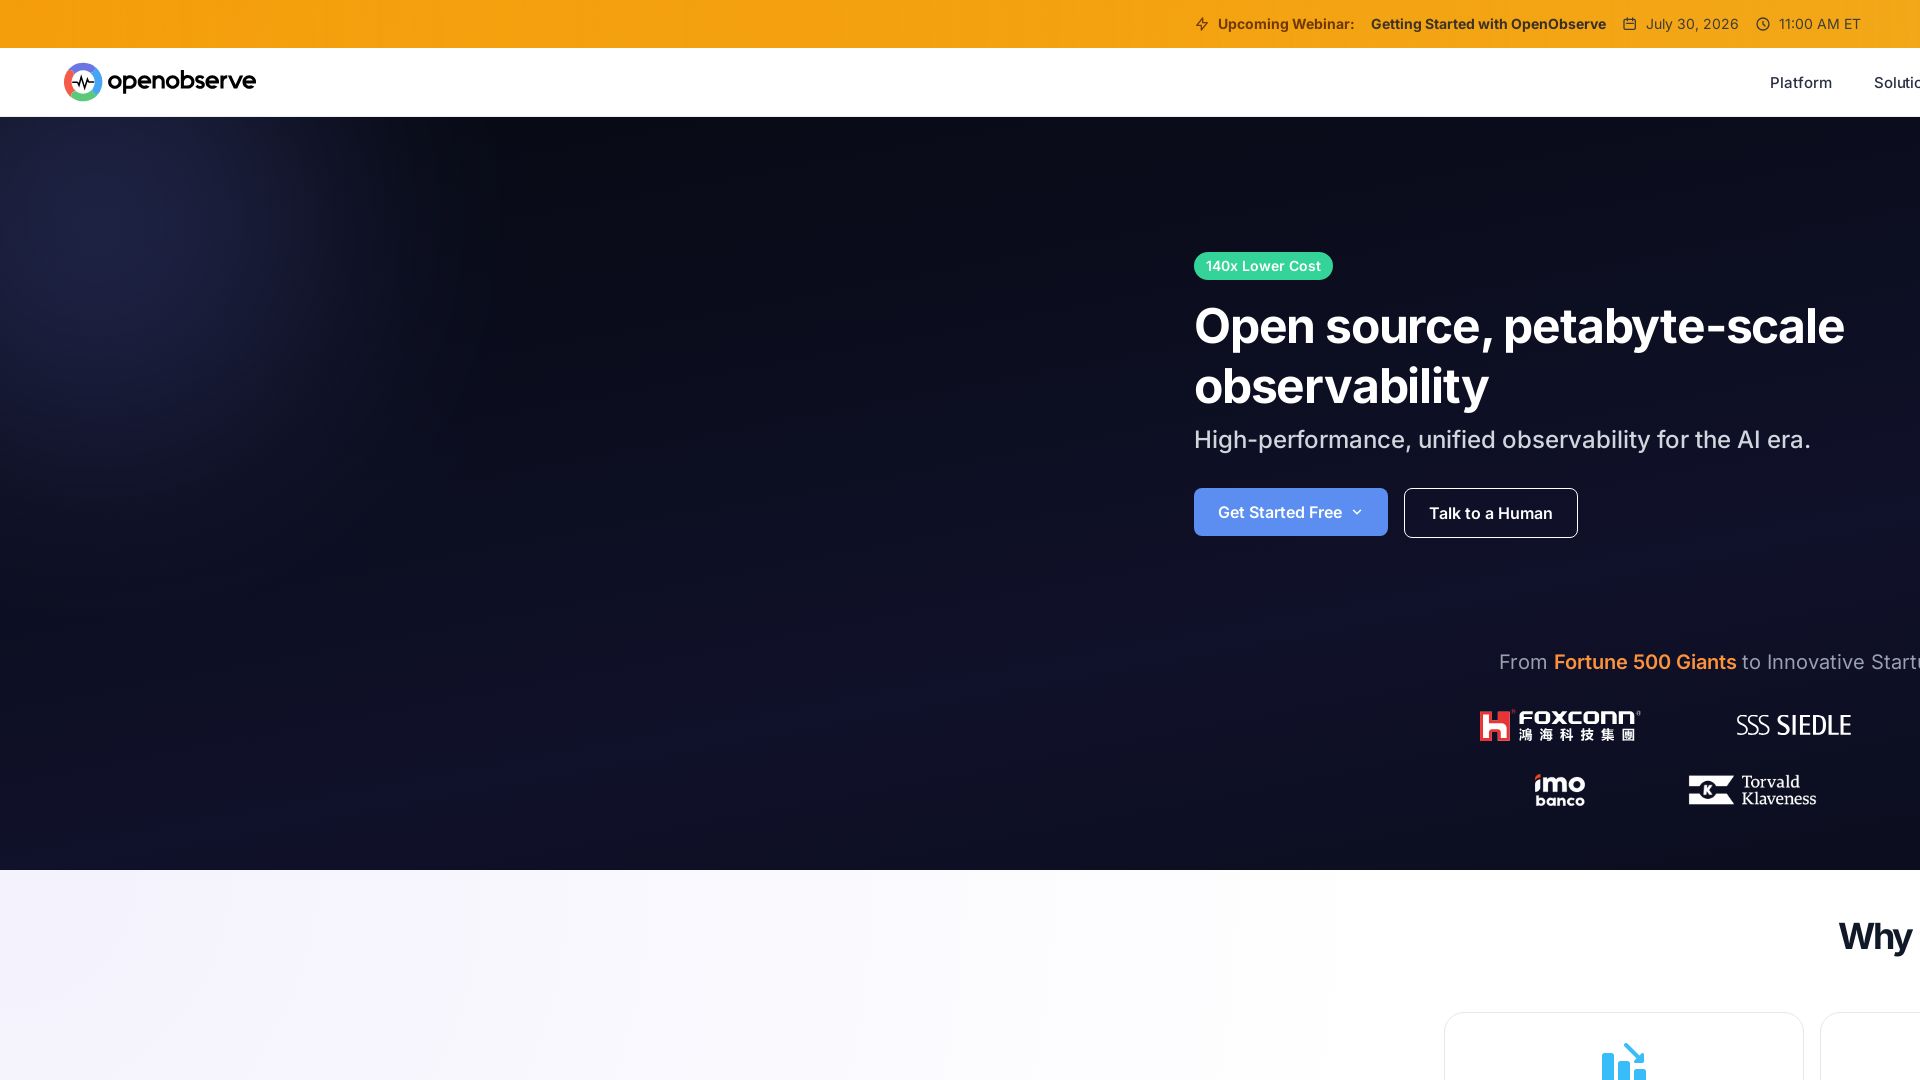
OpenObserve unifies logs, metrics, traces, and RUM in one open source platform. Up to 140x lower cost than Elasticsearch. OpenTelemetry native. Try free.

Continue
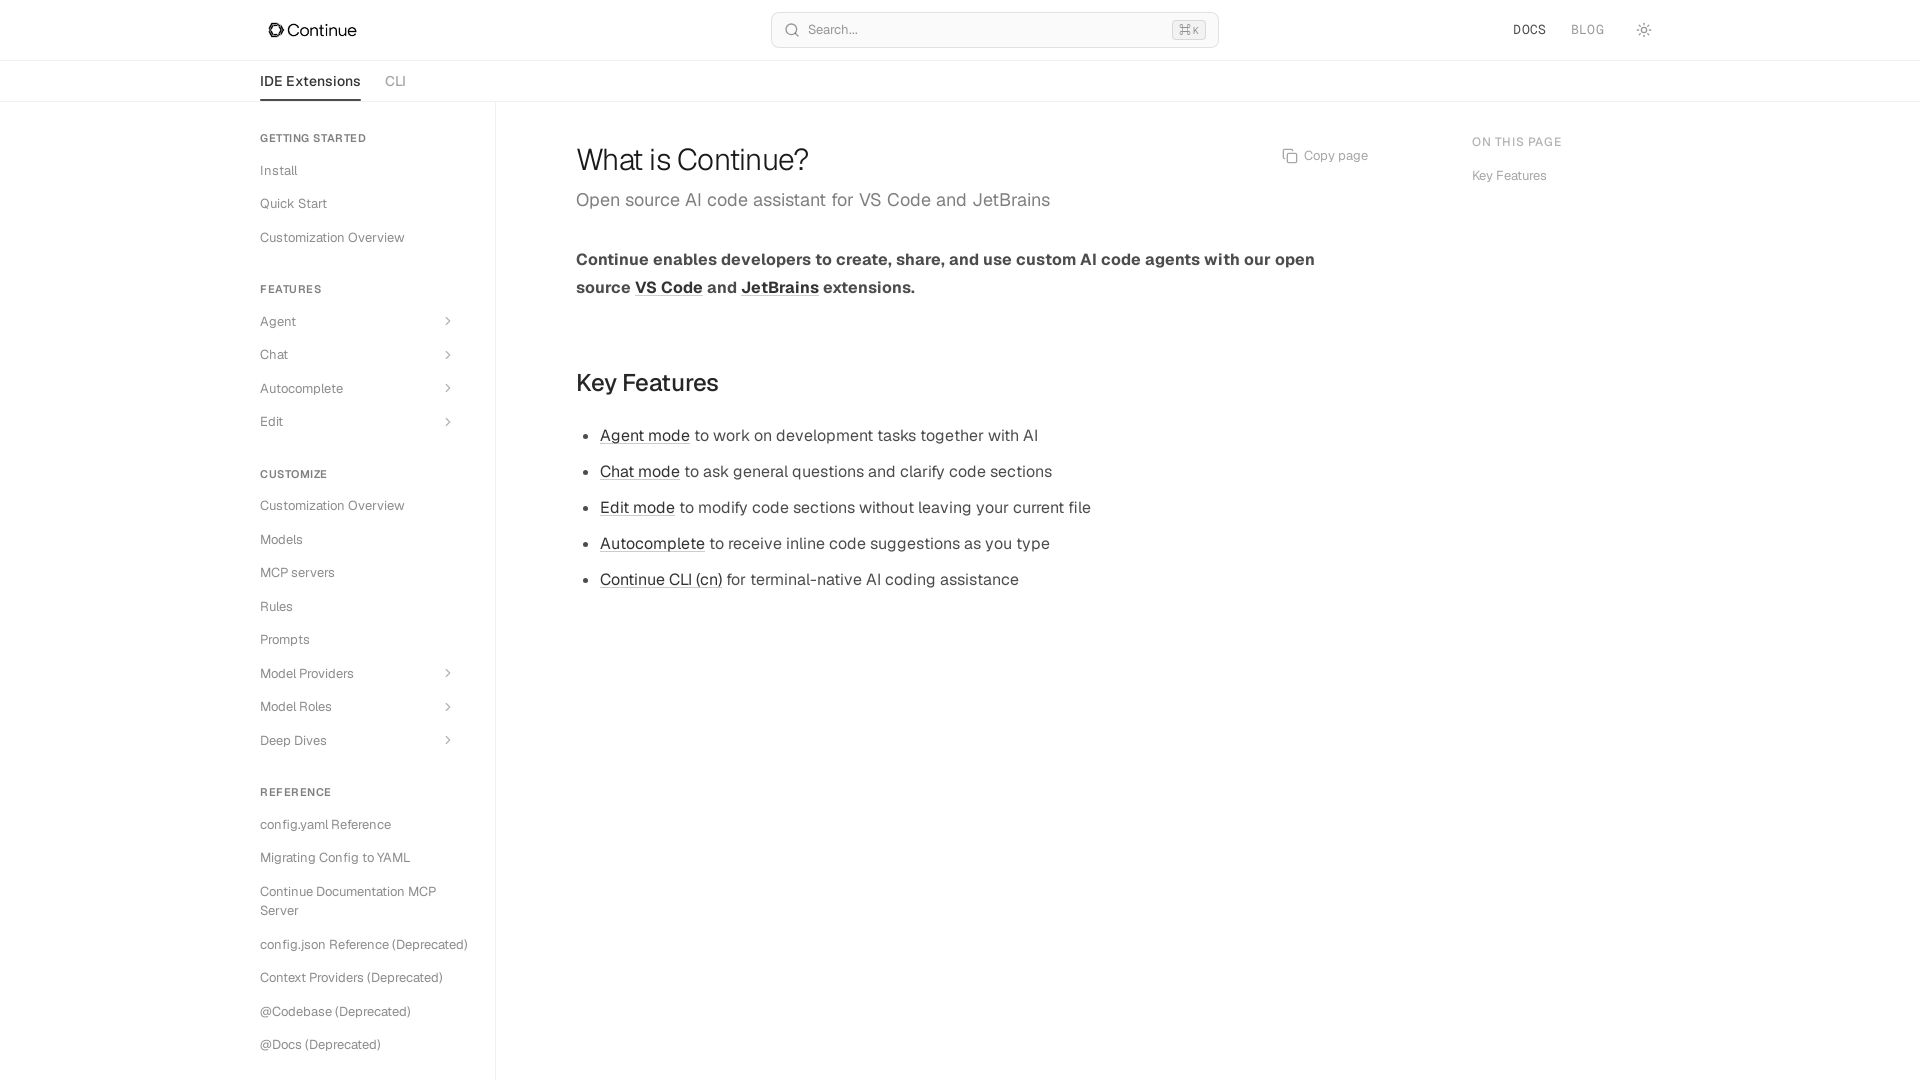
Create, share, and use custom AI code agents with Continue. Features agent, chat, edit modes, and autocomplete for VS Code and JetBrains.

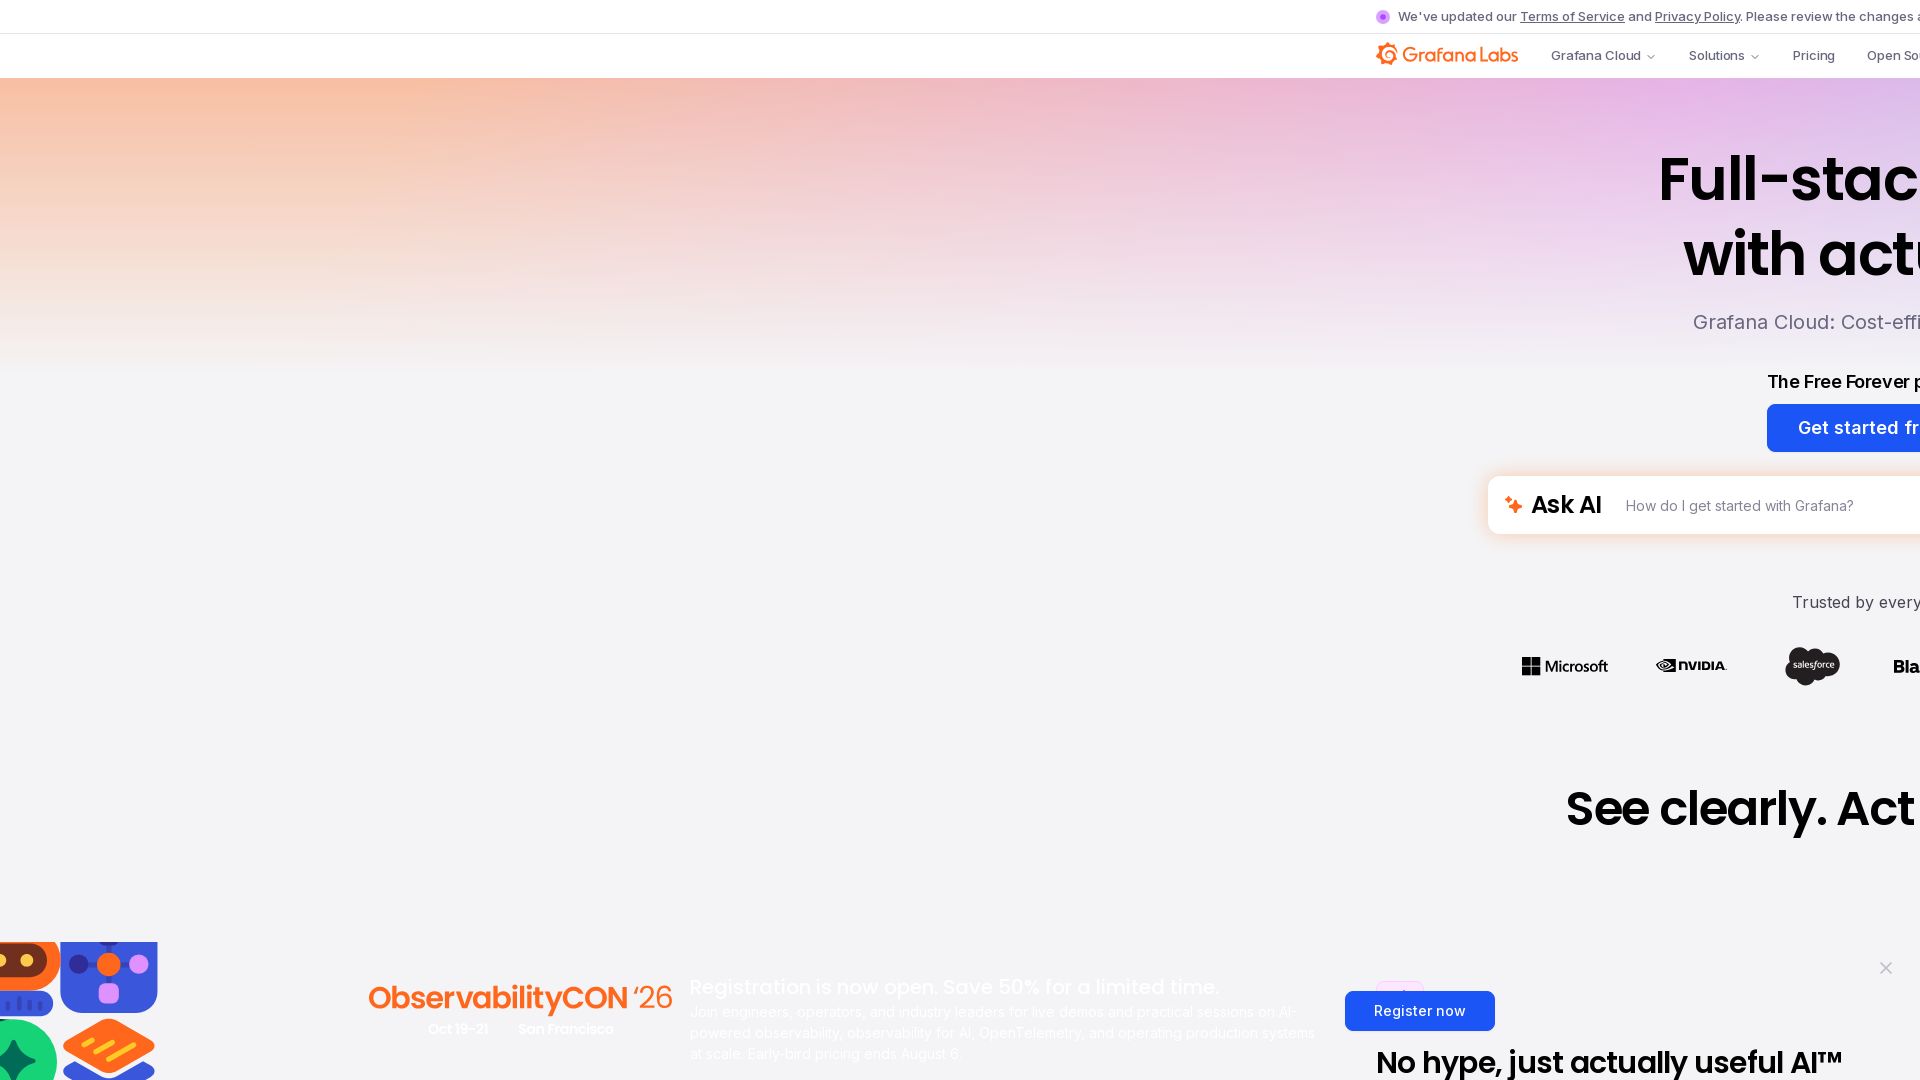
Grafana
Unify metrics, logs, traces & profiles. Cut costs with Adaptive Telemetry. Built-in AI helps you troubleshoot faster. Trusted by Fortune 500. Get started free.

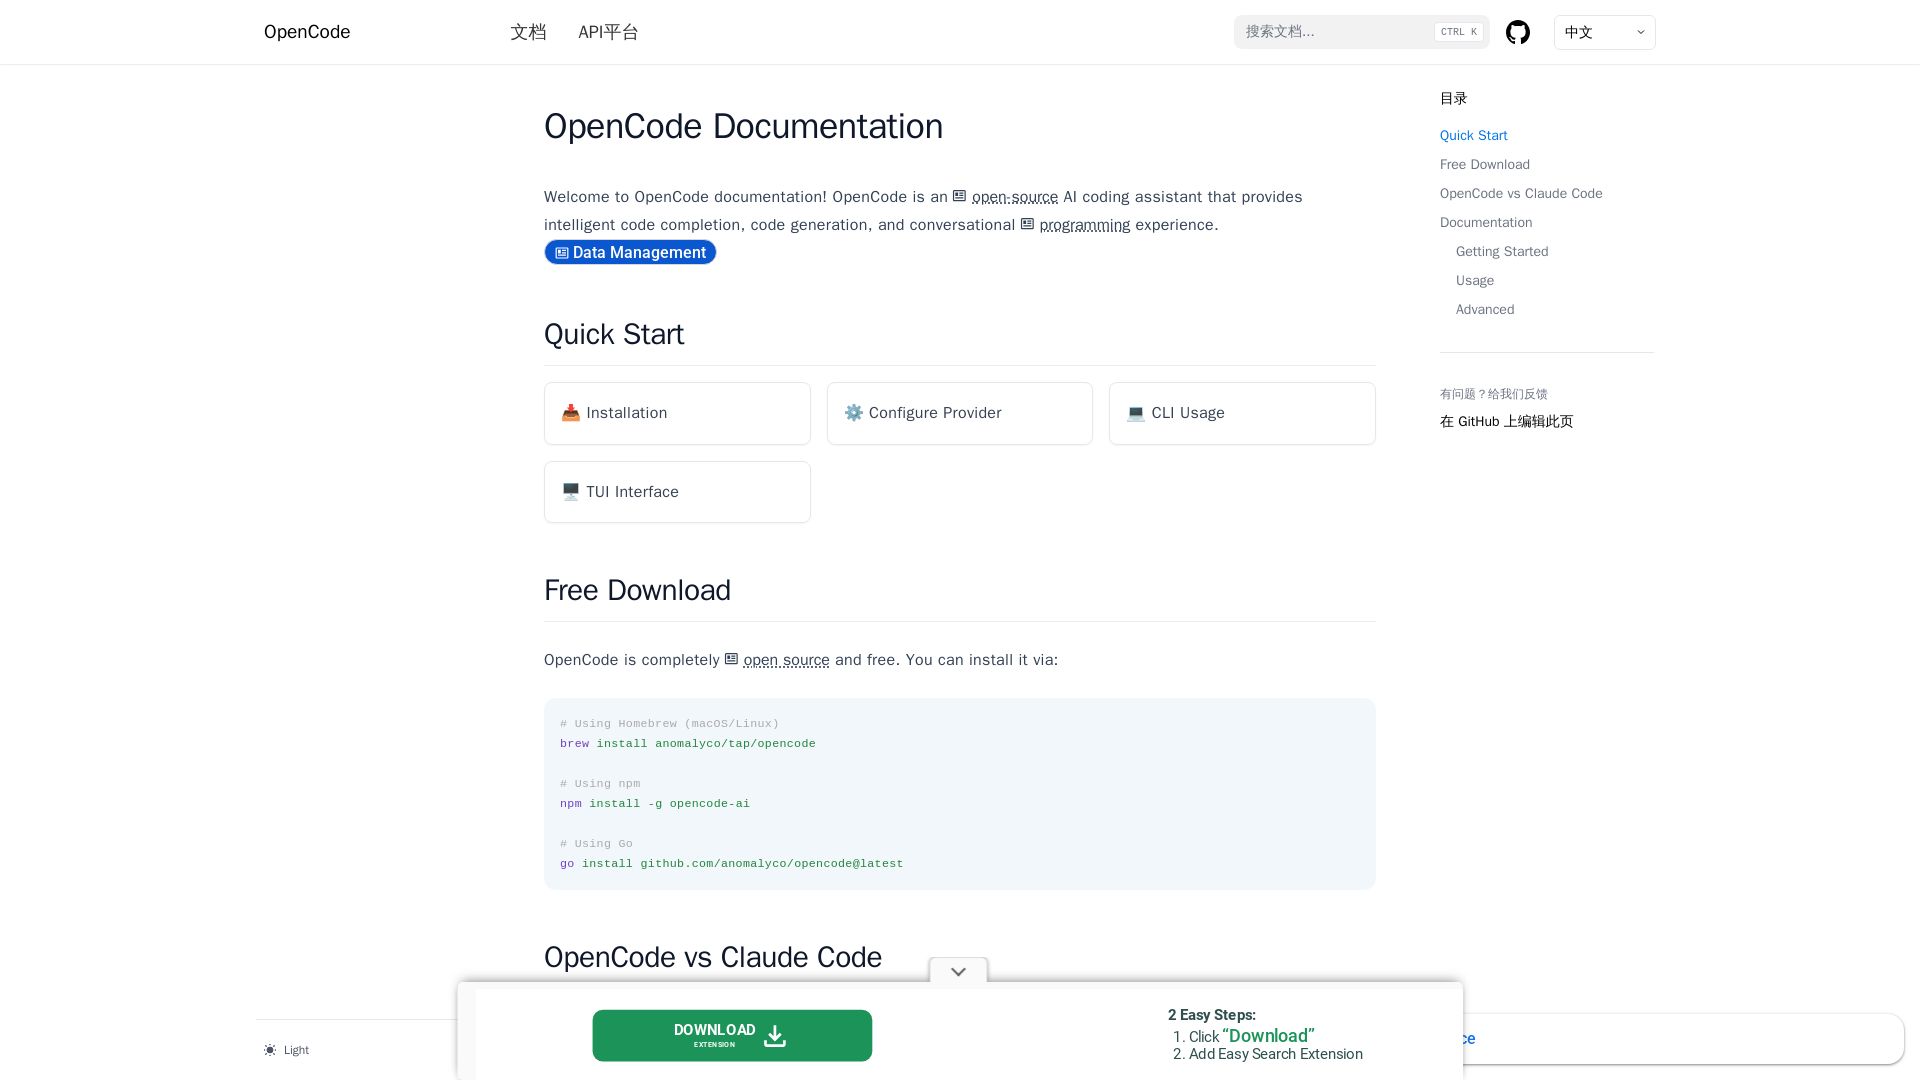
OpenCode
OpenCode is a free, open-source AI coding assistant supporting multiple providers (OpenAI, Anthropic, local models) with CLI/TUI, custom tools, and privacy-centric local execution.

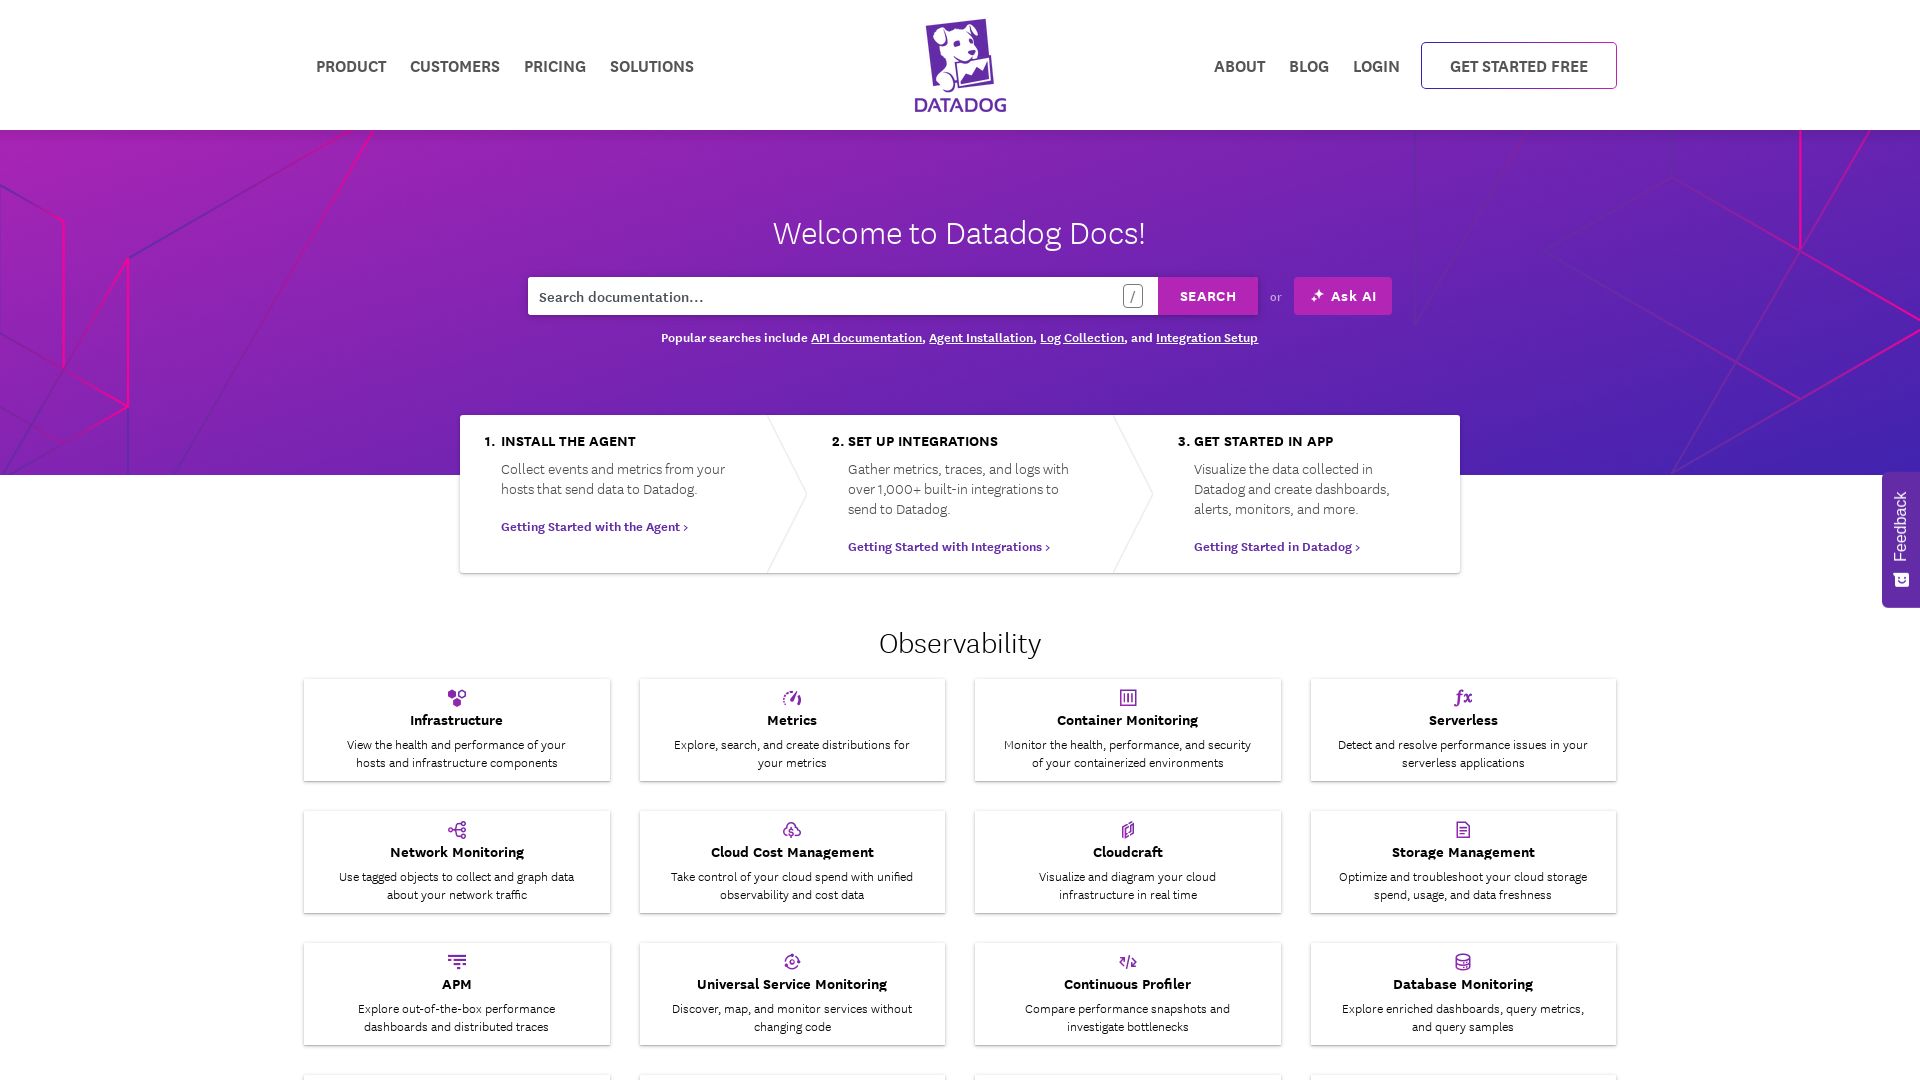
Datadog
Explore Datadog docs for infrastructure, APM, logs, security, digital experience, and AI observability. Get started with integrations and agents.

Tabby
Self-hosted, secure AI coding assistant with code completion, answer engine, and inline chat. Private and flexible.

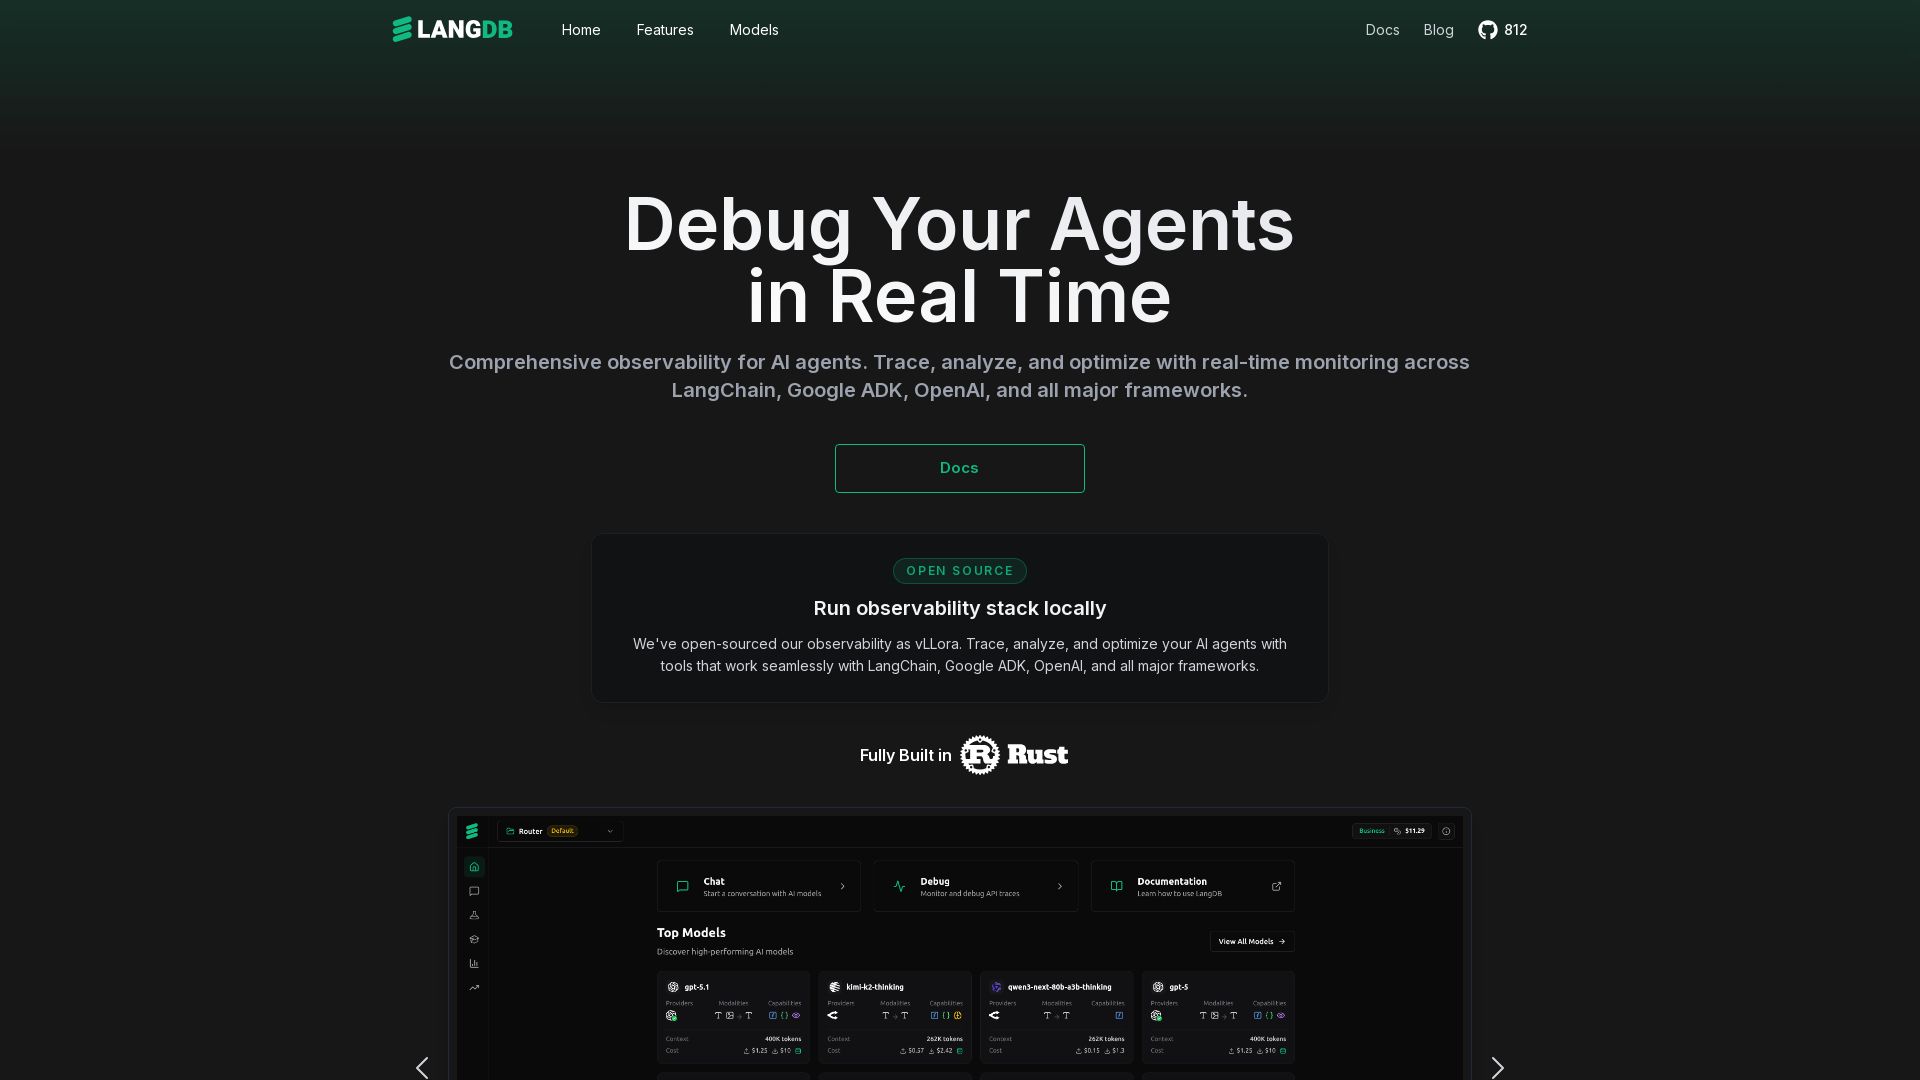
LangDB
Comprehensive observability for AI agents. Trace, analyze, and optimize with real-time monitoring across all major LLM frameworks. Unified API for 250+ models.

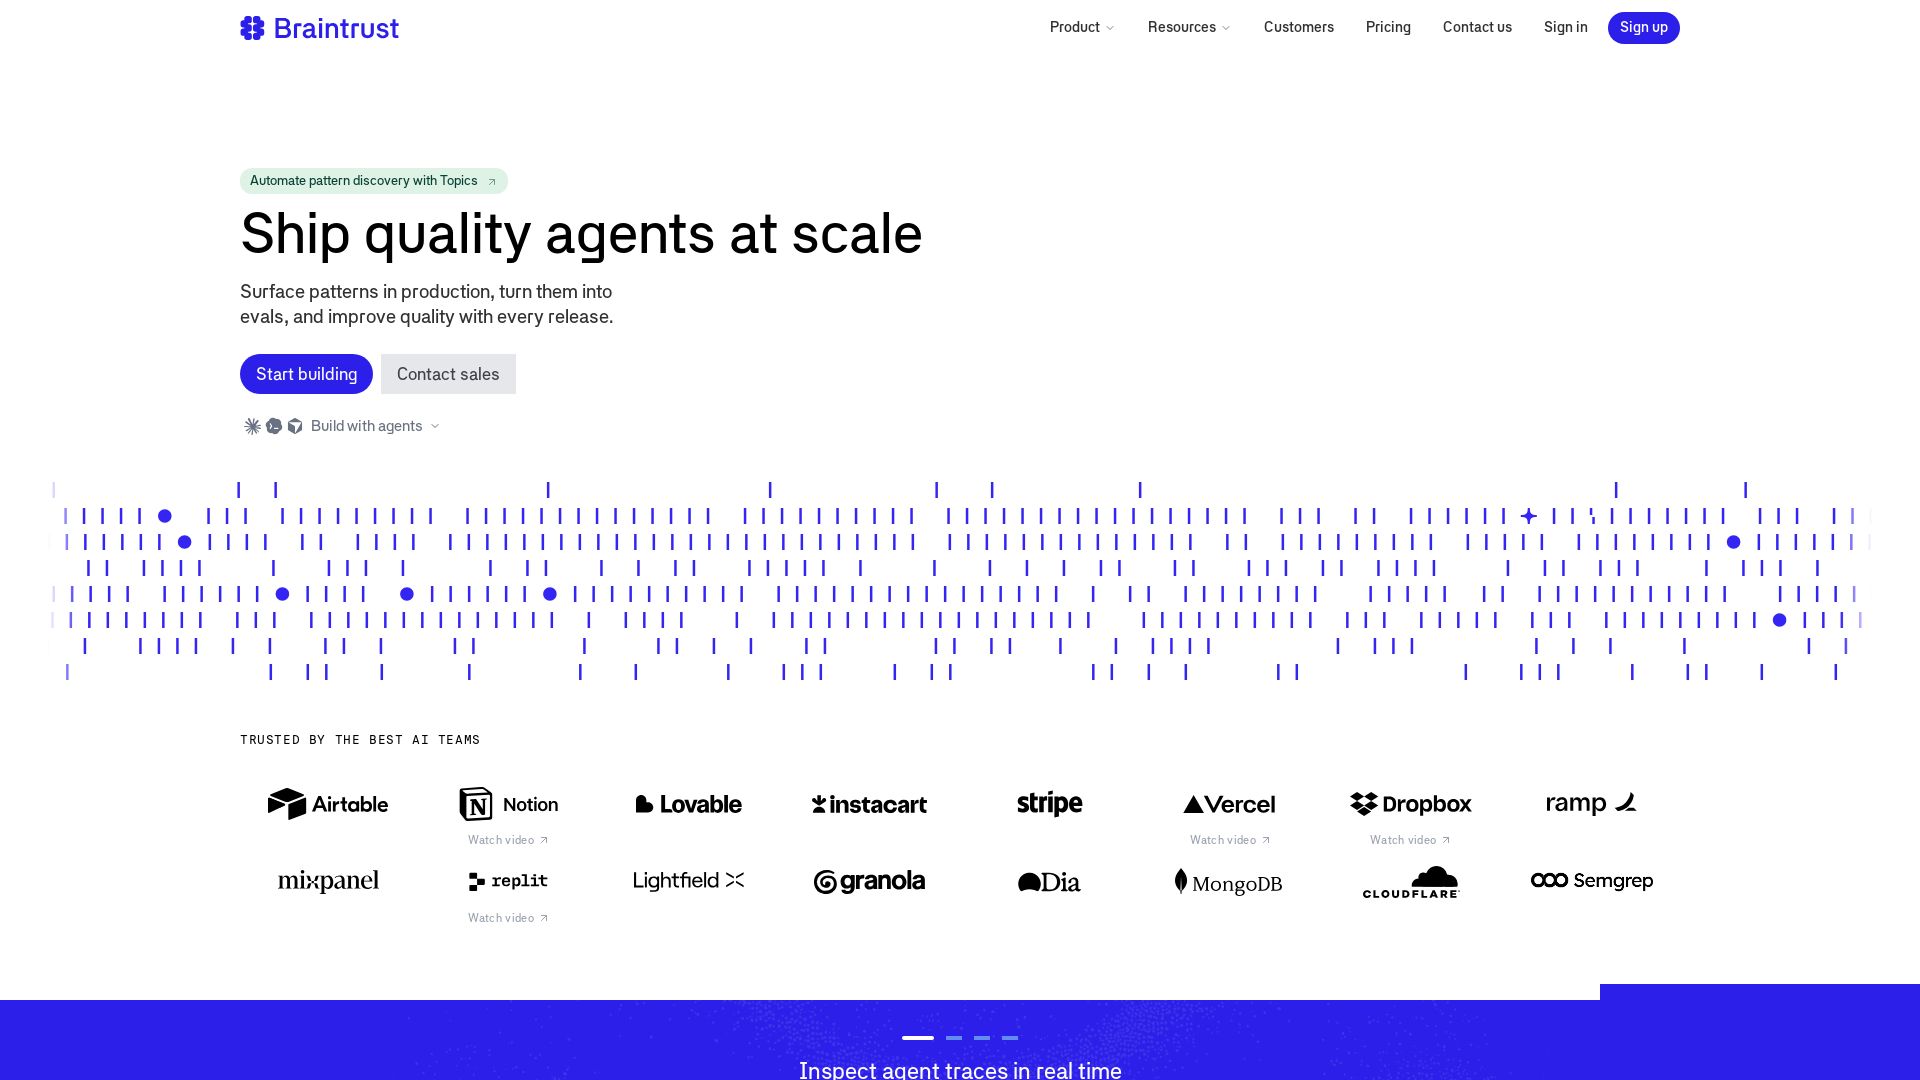
Braintrust
Trace, evaluate, and discover patterns in AI agents. Ship quality agents at scale with real-time observability, evals, and automatic pattern discovery.

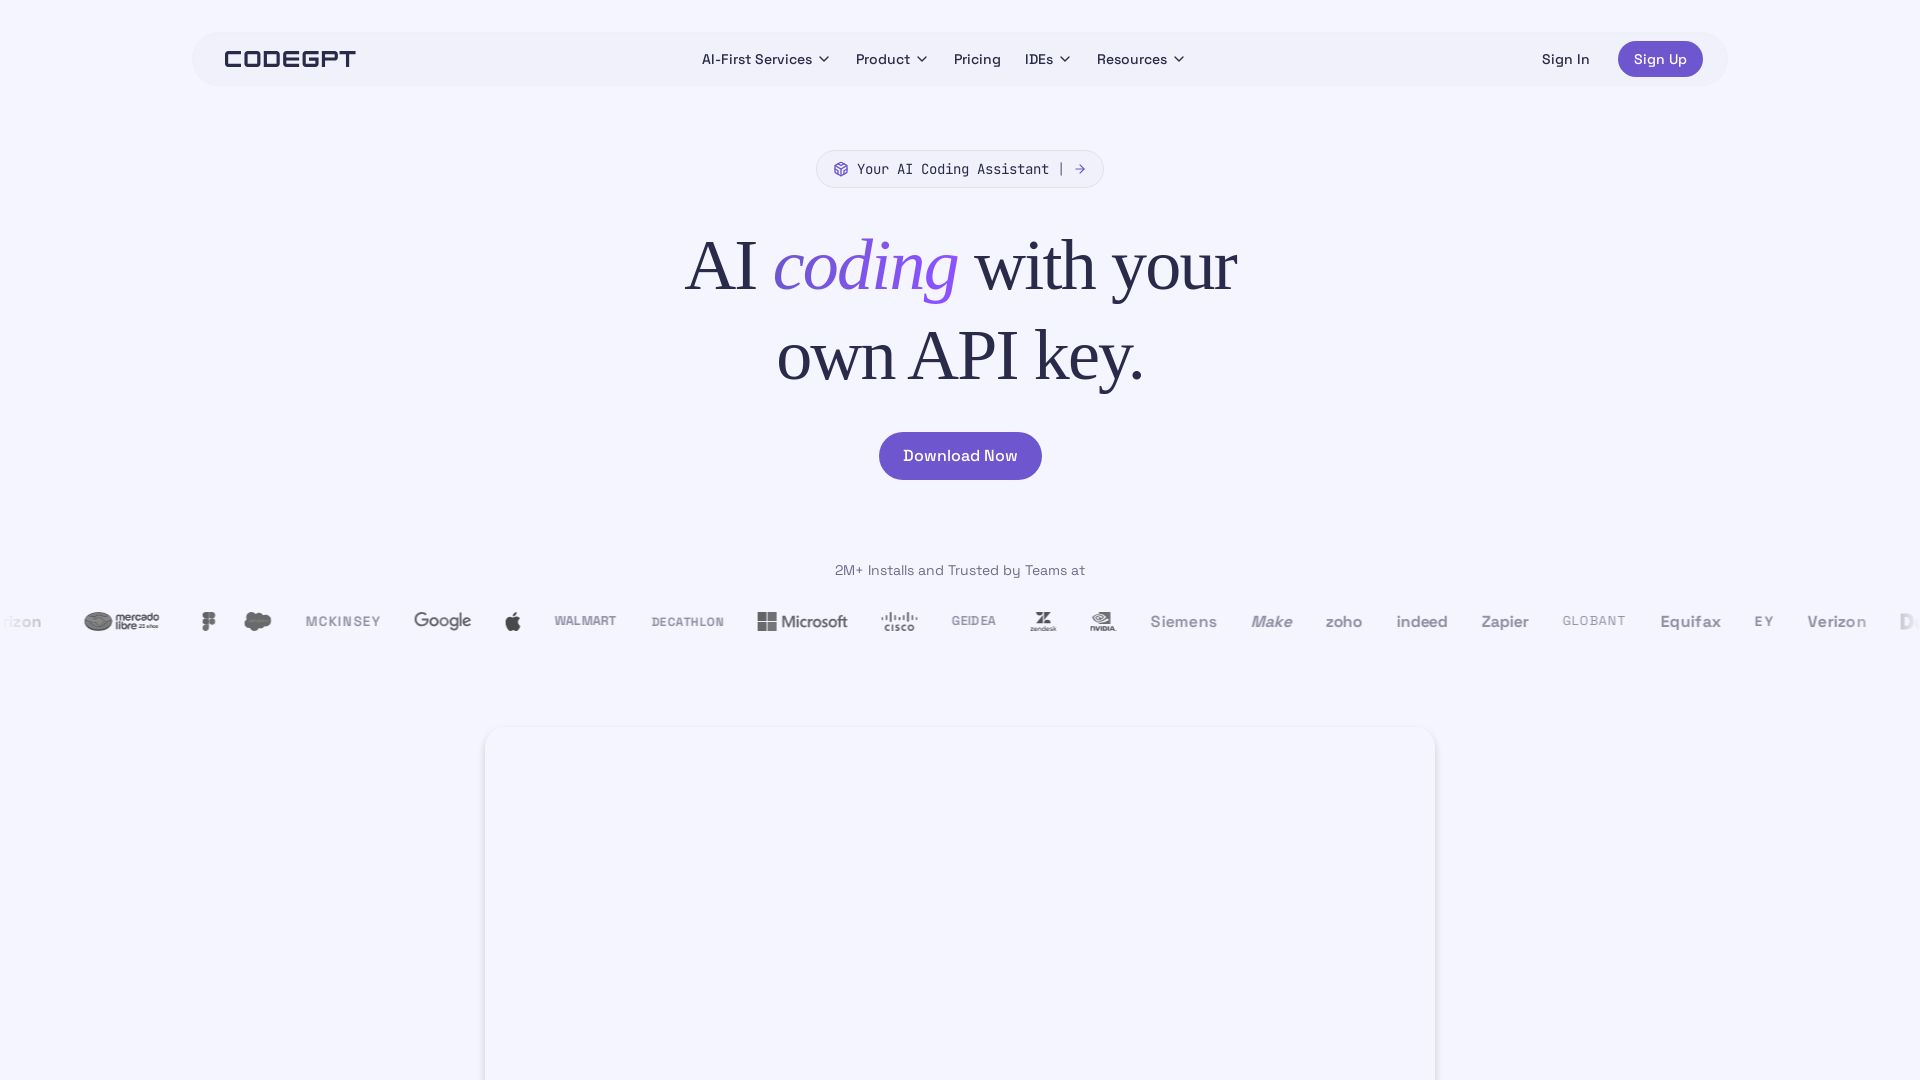
CodeGPT
Bring your own API key for transparent, unlimited AI coding. Supports Claude, Gemini, OpenAI. Privacy-first, no middlemen. Trusted by 2M+ developers.
OpenCode
OpenCode is an open-source, terminal-native AI coding assistant supporting Claude, GPT-4, Gemini, and local models. Boost productivity with agent mode and seamless CLI integration.

zircote
Explore insights on backend architecture, AI development, observability, and regenerative agriculture by technologist Robert Allen.
ℹ️ Curation Disclosure: The overview and features of Sentry were synthesized using AI and fact-checked by our curation team to ensure accuracy.