
Grafana
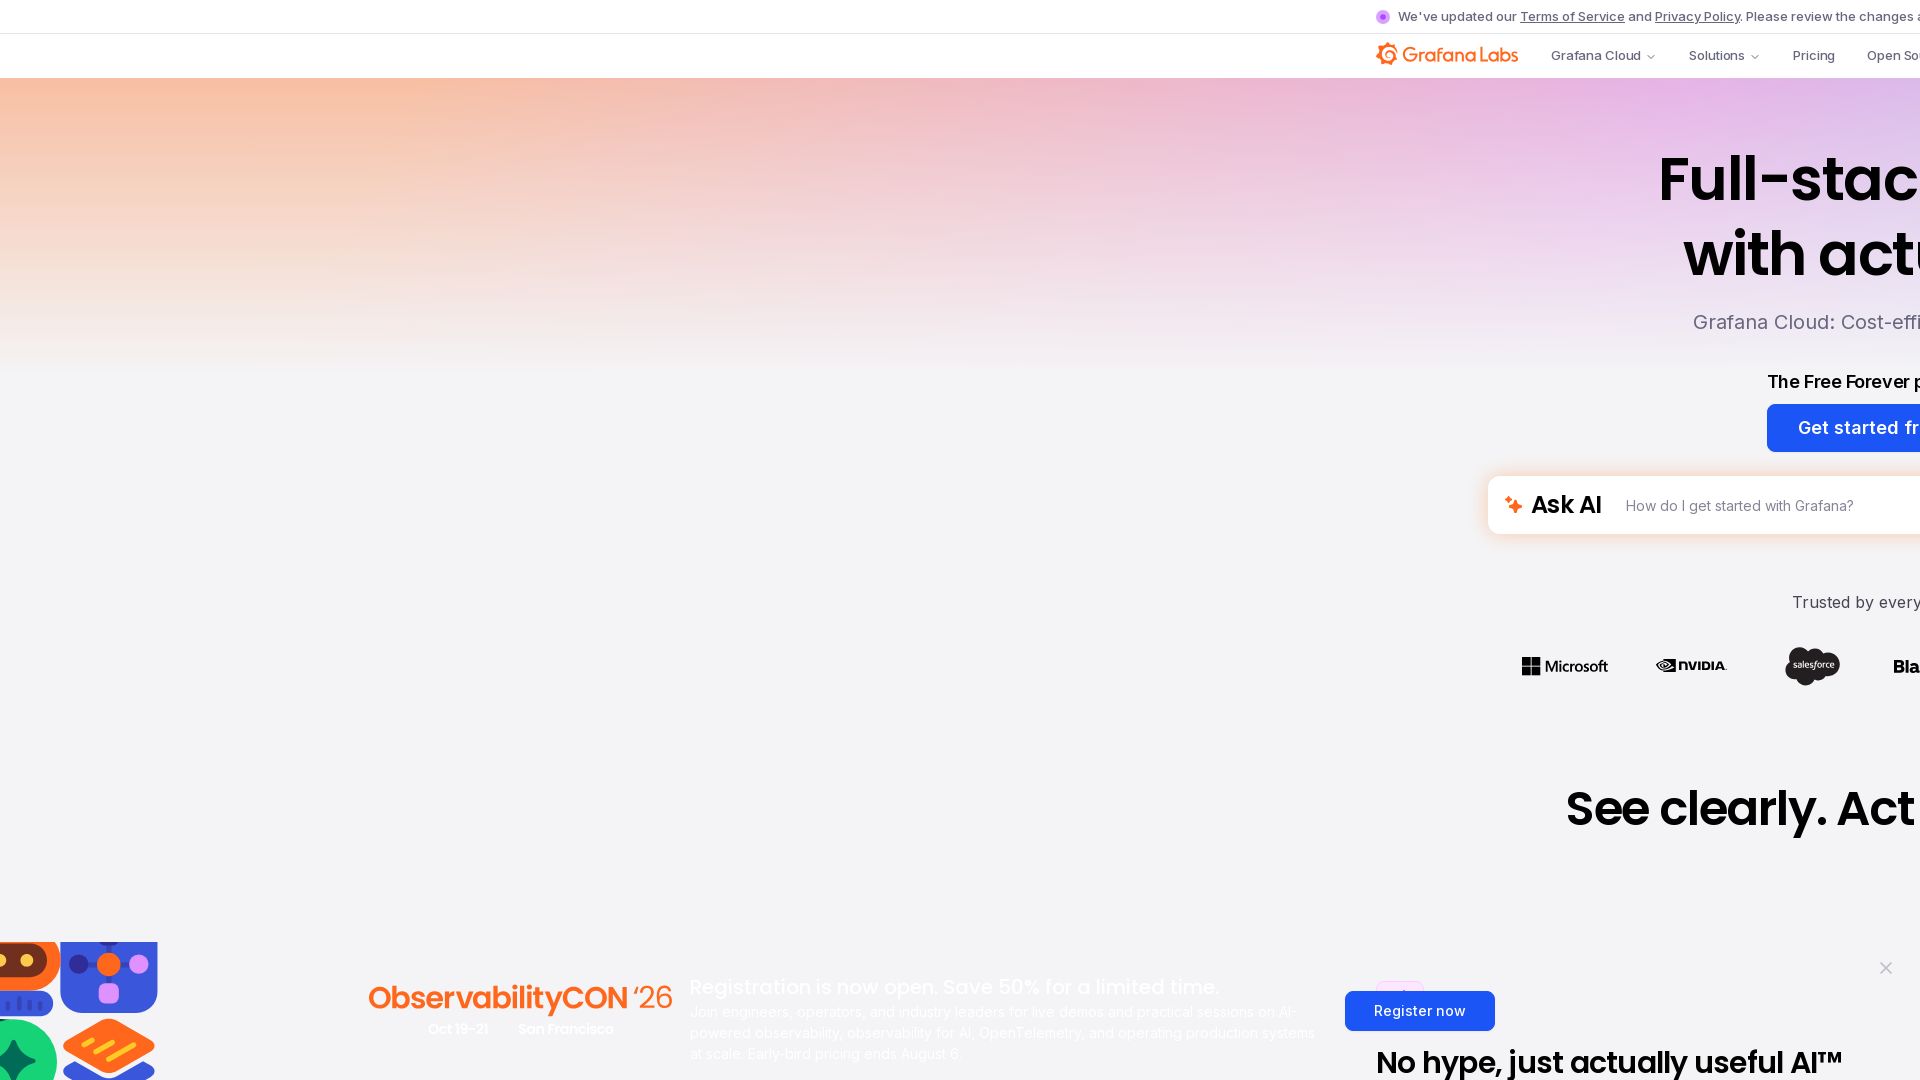
Unify metrics, logs, traces & profiles. Cut costs with Adaptive Telemetry. Built-in AI helps you troubleshoot faster. Trusted by Fortune 500. Get started free.


Editor's Verdict
Key Takeaways
- Full-Stack Observability
- Actually Useful AI
- Adaptive Telemetry
- Open Standards & Integrations
In-Depth Review: What is Grafana?
Grafana Cloud is the open observability cloud that brings together metrics, logs, traces, and profiles in a single, cost-efficient platform. Leverage built-in AI to build dashboards, detect anomalies, and resolve incidents faster. With Adaptive Telemetry, you automatically reduce telemetry costs by up to 80% without losing insights. Connect your existing tools via hundreds of integrations and plugins, all built on open standards like OpenTelemetry and Prometheus. Whether you're an SRE or a developer, Grafana Cloud empowers you to see clearly, act faster, and spend smarter.
Core Features
Full-Stack Observability
Unify metrics, logs, traces, and profiles into a single map for faster troubleshooting.
Actually Useful AI
Built-in AI assistant helps build dashboards, find and fix issues, and answer complex queries in natural language.
Adaptive Telemetry
Automatically identifies valuable data and aggregates the rest, reducing telemetry costs by up to 80%.
Open Standards & Integrations
Built on OpenTelemetry and Prometheus with hundreds of plugins to connect existing tools without rip-and-replace.
Kubernetes Monitoring
End-to-end observability for Kubernetes clusters, including performance, health, and cost monitoring.
Incident Response & Management
Fully-managed incident management with on-call scheduling, notifications, and response workflows.
Pricing
Free
- 10k active series (metrics)
- 50 GB ingested per month (logs, traces, profiles)
- 14 days retention
- 3 active users (Grafana visualization)
- 3 active AI users
- Community support
Pro
- Pay-as-you-go above free tier
- 13 months retention (metrics)
- 30 days retention (logs, traces, profiles)
- 8×5 email support
- Volume discounts automatically applied
Enterprise
- Custom retention
- Premium support
- Deployment flexibility (Public Cloud, Federal Cloud, Bring Your Own Cloud)
- Minimum annual commit
Pros and Cons
Pros
- Cost EfficiencyAdaptive Telemetry and usage-based pricing cut telemetry costs by up to 80%, paying only for what matters.
- Actually Useful AIAI assistant reduces time to build dashboards and troubleshoot, with natural language querying.
- Open & IntegrableBuilt on open standards (OpenTelemetry, Prometheus) with hundreds of plugins, avoiding vendor lock-in.
- Unified ObservabilitySingle pane of glass for metrics, logs, traces, profiles, and more, breaking down data silos.
- Generous Free TierFree Forever plan includes substantial usage limits for personal projects and startups.
Cons
- Complex PricingPricing can be difficult to estimate due to multiple factors (usage, retention, volume discounts).
- Learning CurveFull-stack observability and Grafana ecosystem can be overwhelming for new users.
- Dependency on Grafana StackBest results require using Grafana's own agents and tools, which may not suit all environments.
- Limited Support in Free TierFree tier only includes community support, which may be insufficient for critical applications.
- High Cost at ScaleWhile volume discounts exist, large-scale deployments can still become expensive.
Use Cases & Recommended Professions
Site Reliability Engineer (SRE)→ View Toolkit
Needs unified observability to monitor system health, reduce MTTR, and manage incidents efficiently.
DevOps Engineer→ View Toolkit
Requires integration with existing tools and automation to manage infrastructure and deployments.
Software Engineer→ View Toolkit
Uses application observability and profiling to debug performance issues and optimize code.
Platform Engineer→ View Toolkit
Builds and maintains internal developer platforms that require scalable monitoring and cost management.
IT Manager→ View Toolkit
Needs a cost-effective, secure solution for enterprise-wide observability with compliance certifications.
Data Analyst / Data Engineer→ View Toolkit
Leverages dashboards and AI assistant to query and visualize large volumes of telemetry data.
Frequently Asked Questions
Alternative AI Tools
View Detailed Comparison →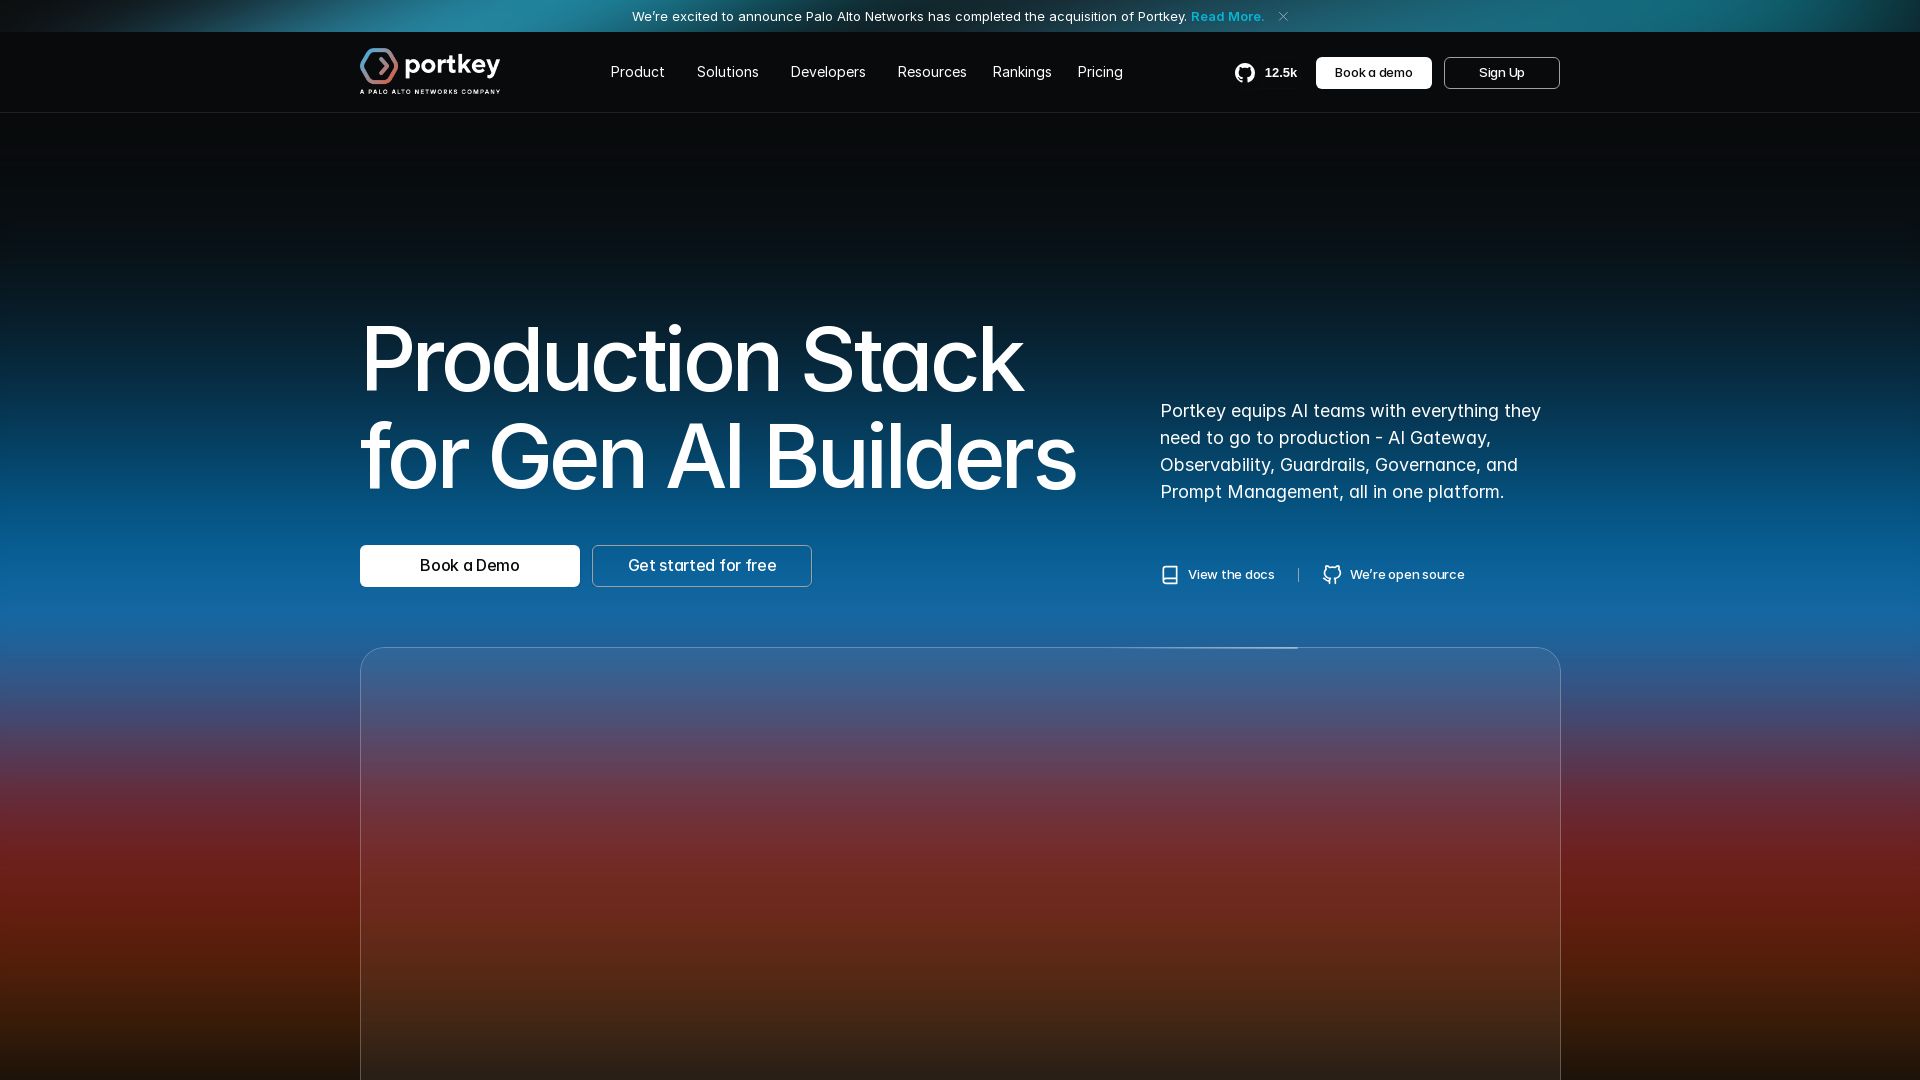
Portkey
Portkey equips AI teams with AI Gateway, Observability, Guardrails, and Prompt Management. Unified API for 1600+ LLMs. Save costs with caching. Trusted by Fortune 500s.

HyperScale Ai
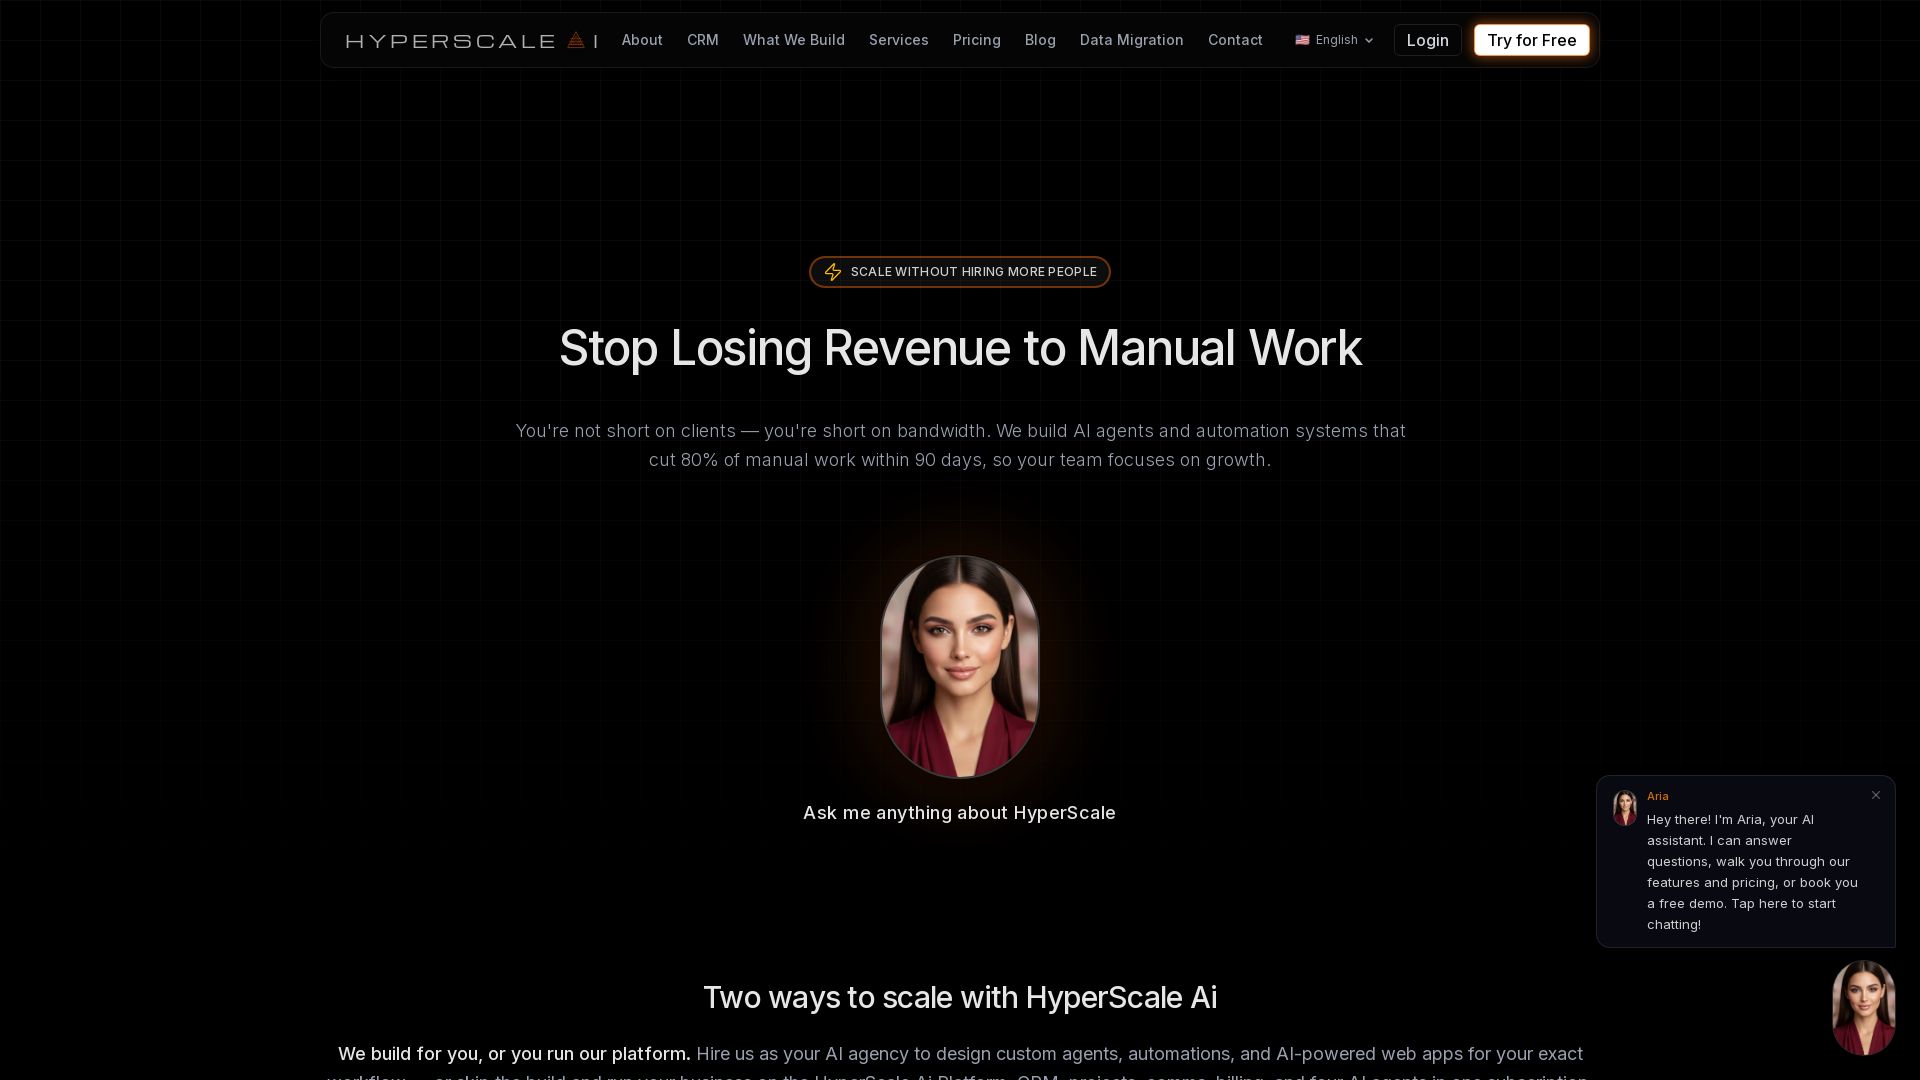
Replace 8+ tools with one AI-native platform: CRM, projects, chat, billing, and 4 AI agents. Or hire us to build custom AI agents and automation. Scale without hiring.

LangDB
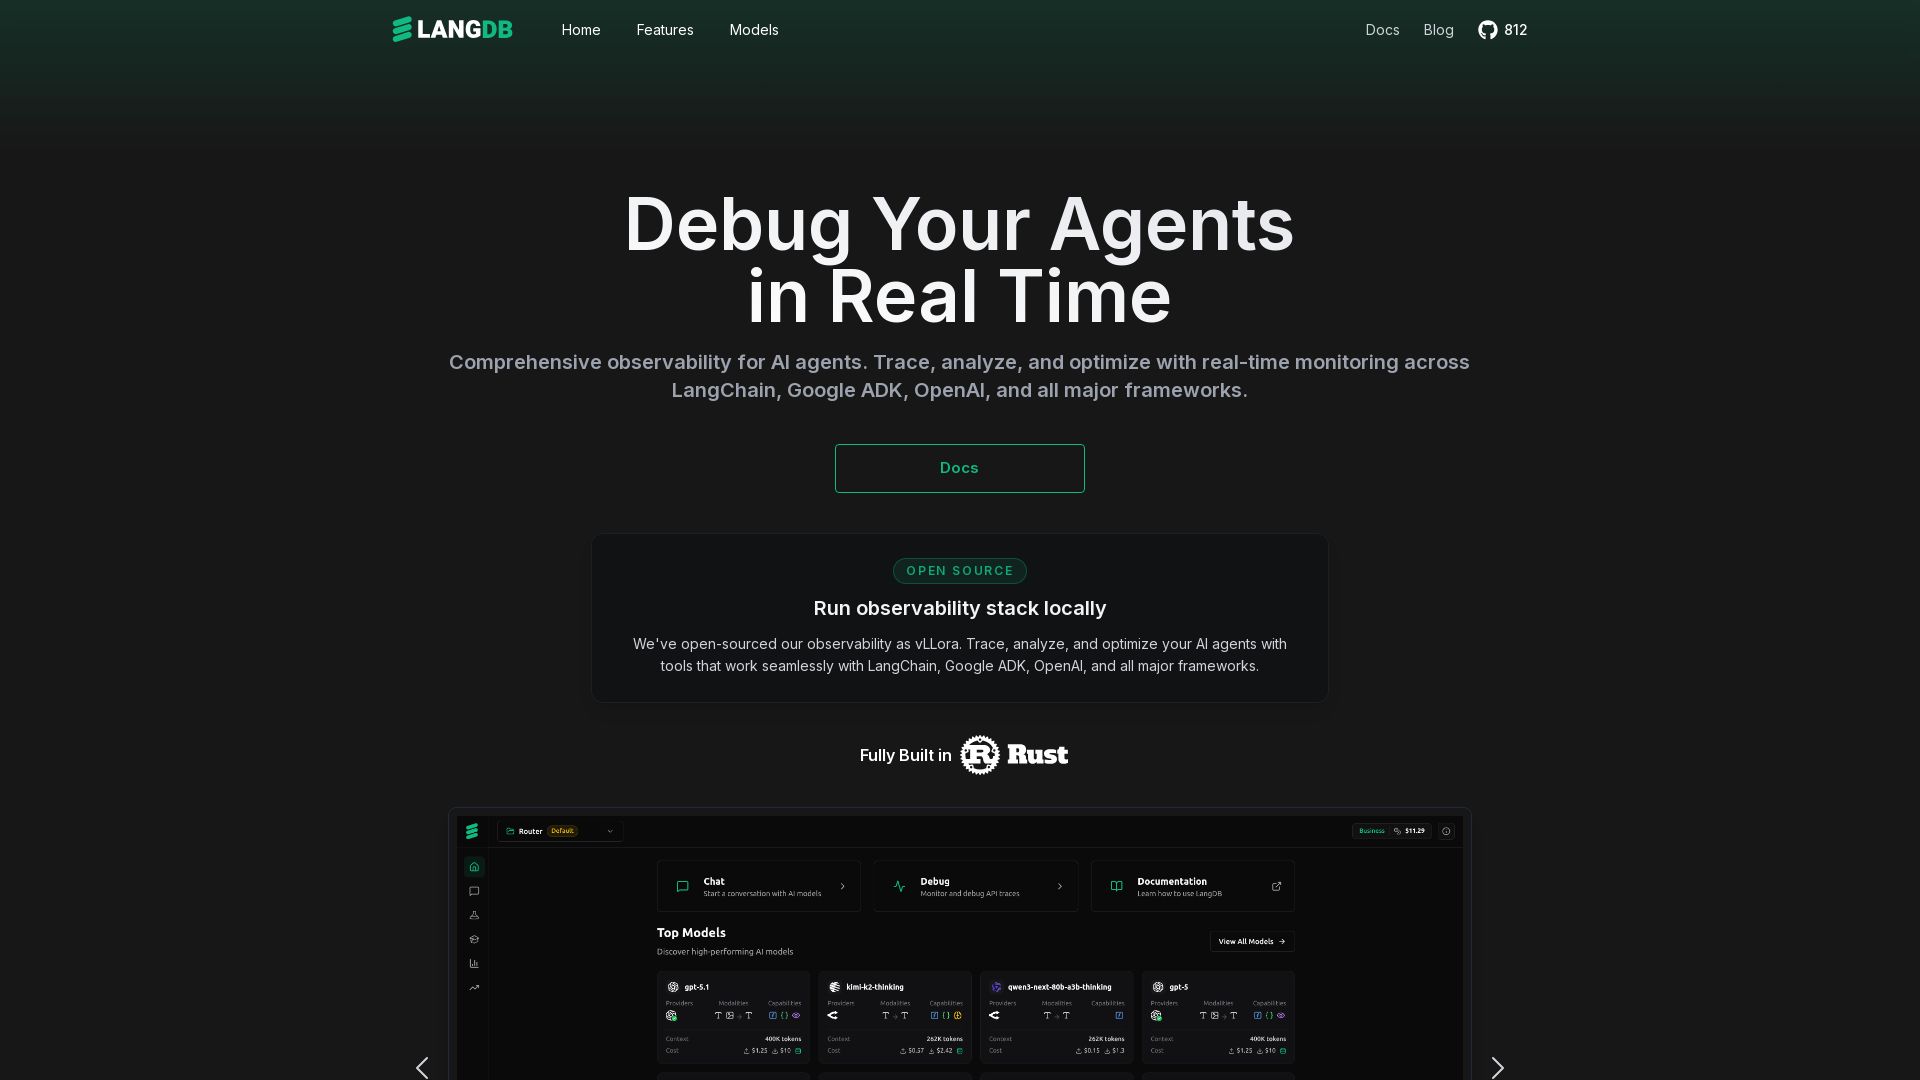
Comprehensive observability for AI agents. Trace, analyze, and optimize with real-time monitoring across all major LLM frameworks. Unified API for 250+ models.


Pydantic
Build, iterate, and deploy type-safe AI apps with Pydantic Validation, AI, Logfire, and Evals. Open source, developer-first.

I Turned My Android Phone Into an MCP Server
Practical insights on agentic DevOps, AI workflows, and building with GitHub Copilot. Learn from software engineer Hector Flores.

Revefi
Autonomous AI agents optimize cost, performance, and quality across Snowflake, Databricks, BigQuery & LLMs. Reduce data costs by 30-70% in minutes.

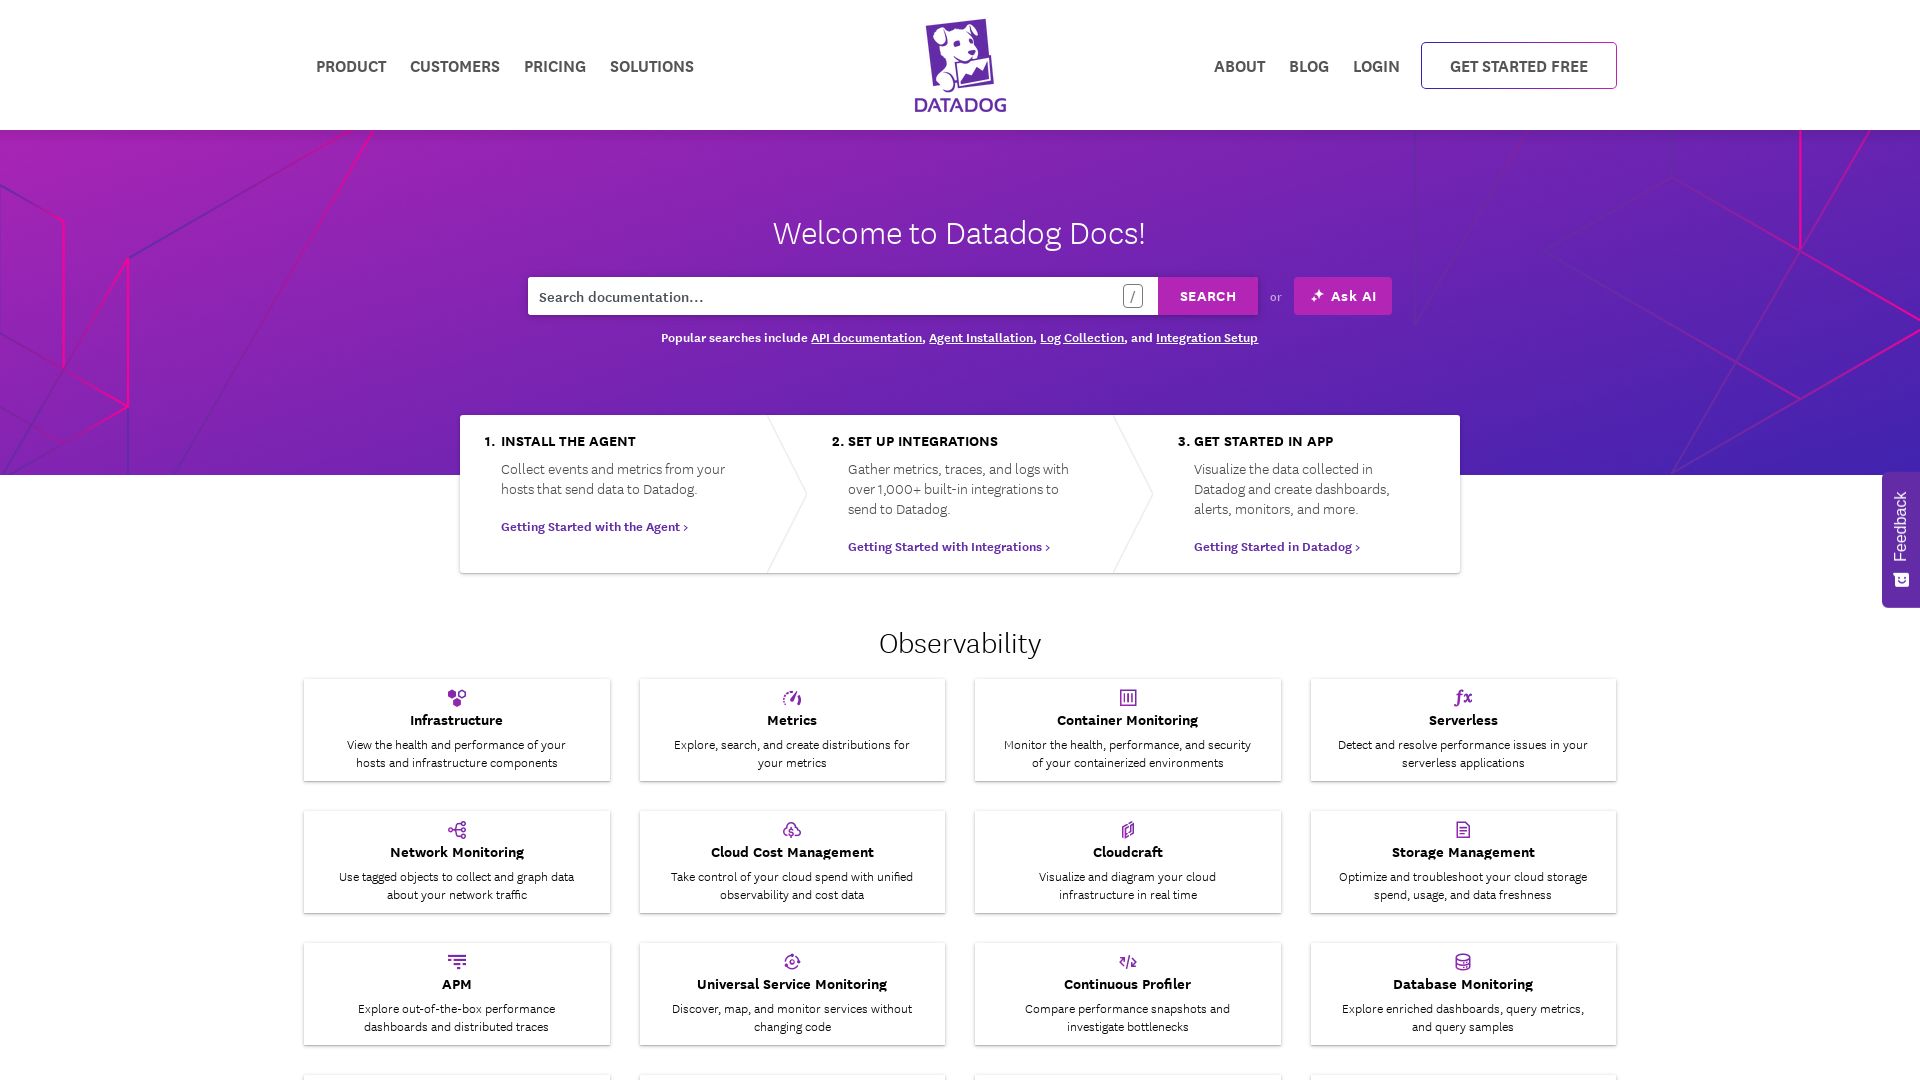
Datadog
Explore Datadog docs for infrastructure, APM, logs, security, digital experience, and AI observability. Get started with integrations and agents.

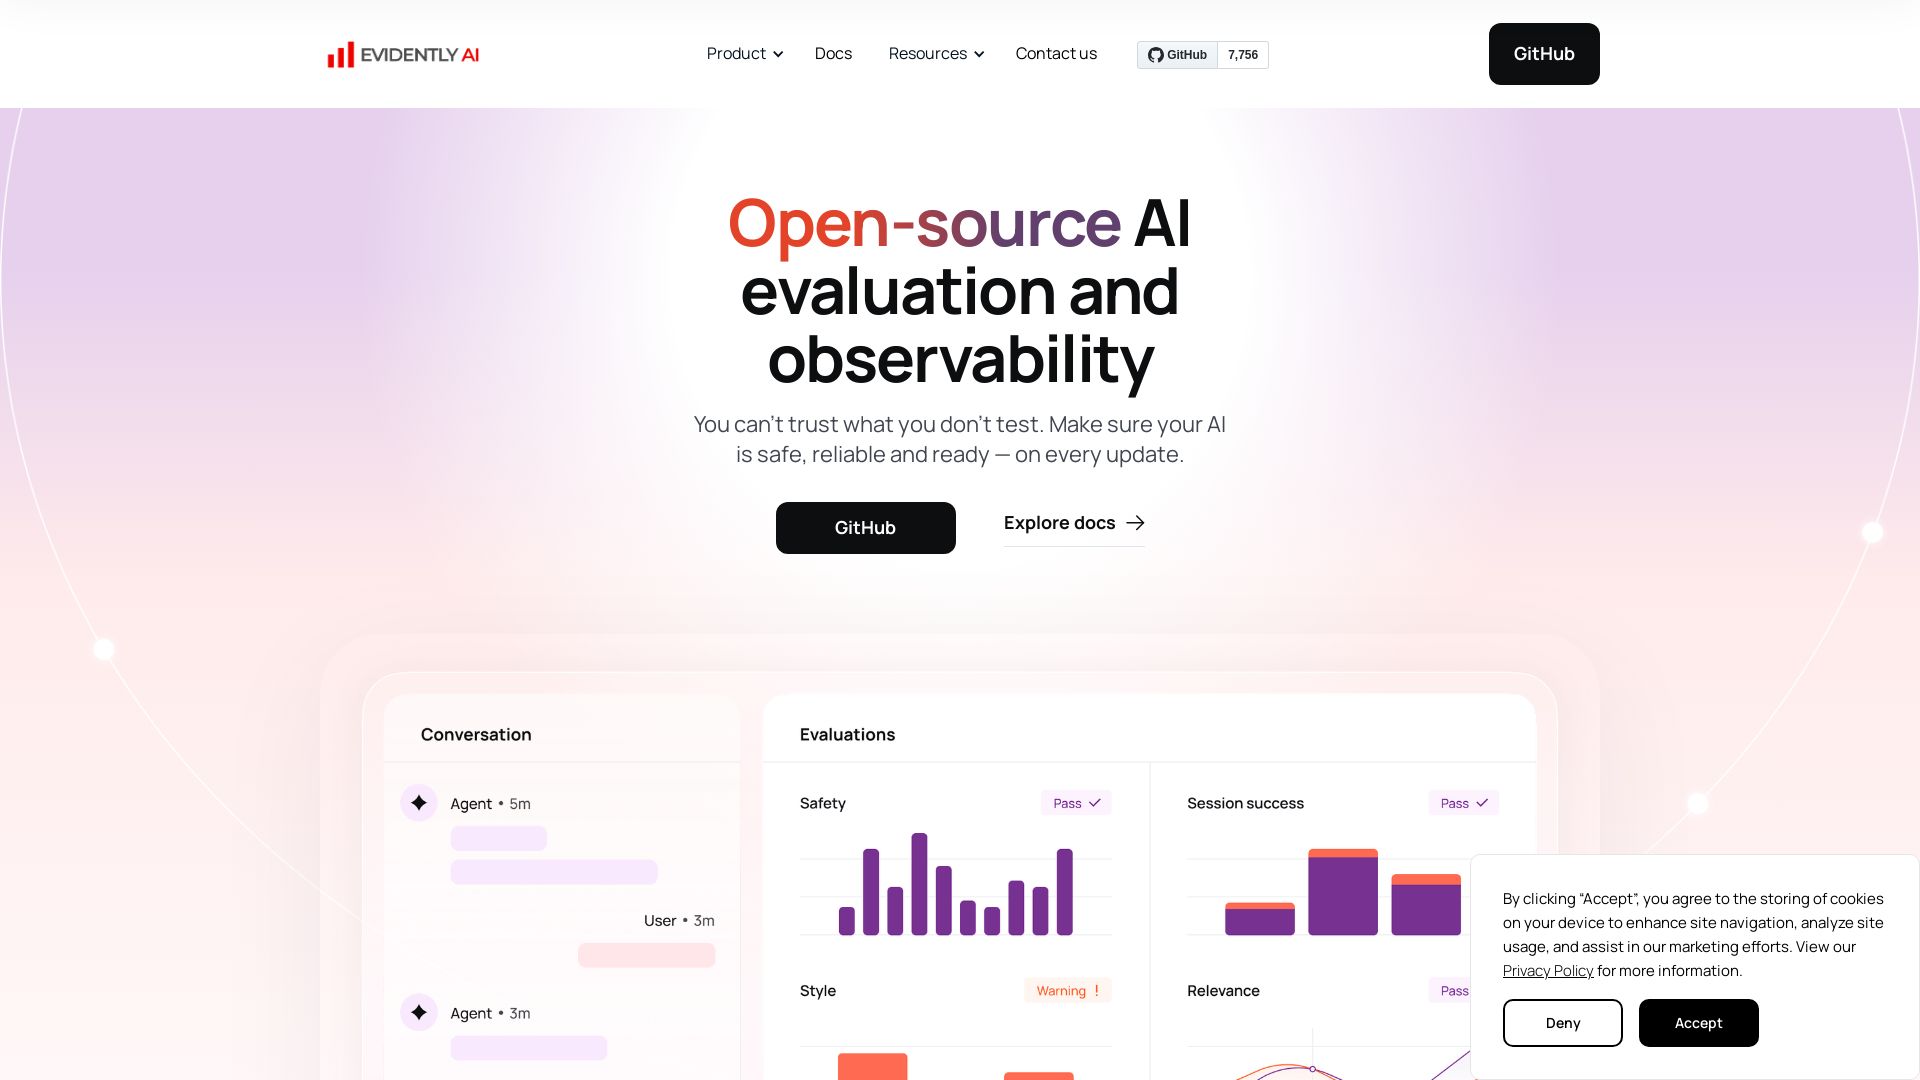
Evidently AI
Evaluate, test, and monitor LLMs, RAG, AI agents, and ML models. Open-source framework to ensure AI safety, reliability, and performance.

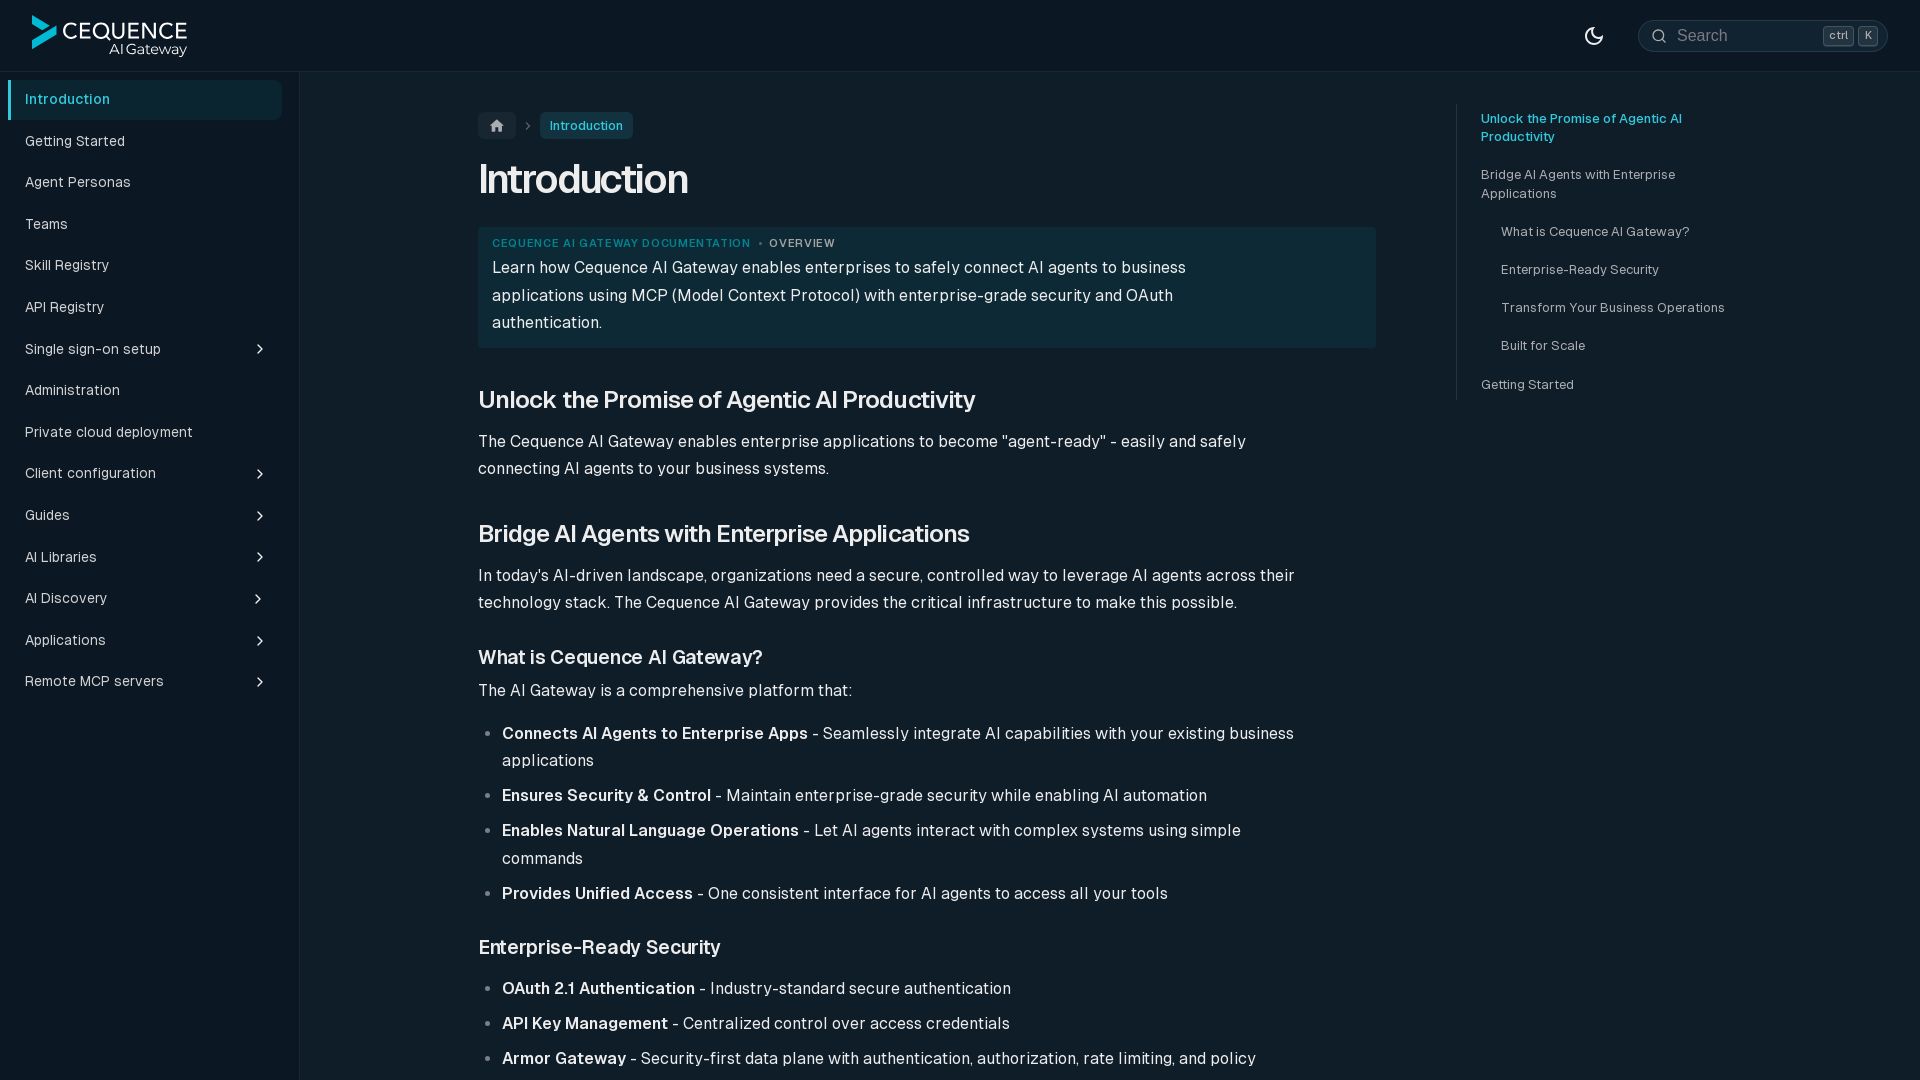
Cequence AI Gateway
Safely connect AI agents to business apps with enterprise-grade security, OAuth 2.1, and MCP. Unlock agentic AI productivity.

ManageEngine
Total visibility and control. Manage identity, endpoints, IT services, security, and more with AI-powered tools. Trusted by enterprises. Free 30-day trials.

Making AI think and act: my approach to the Hugging Face AI ...
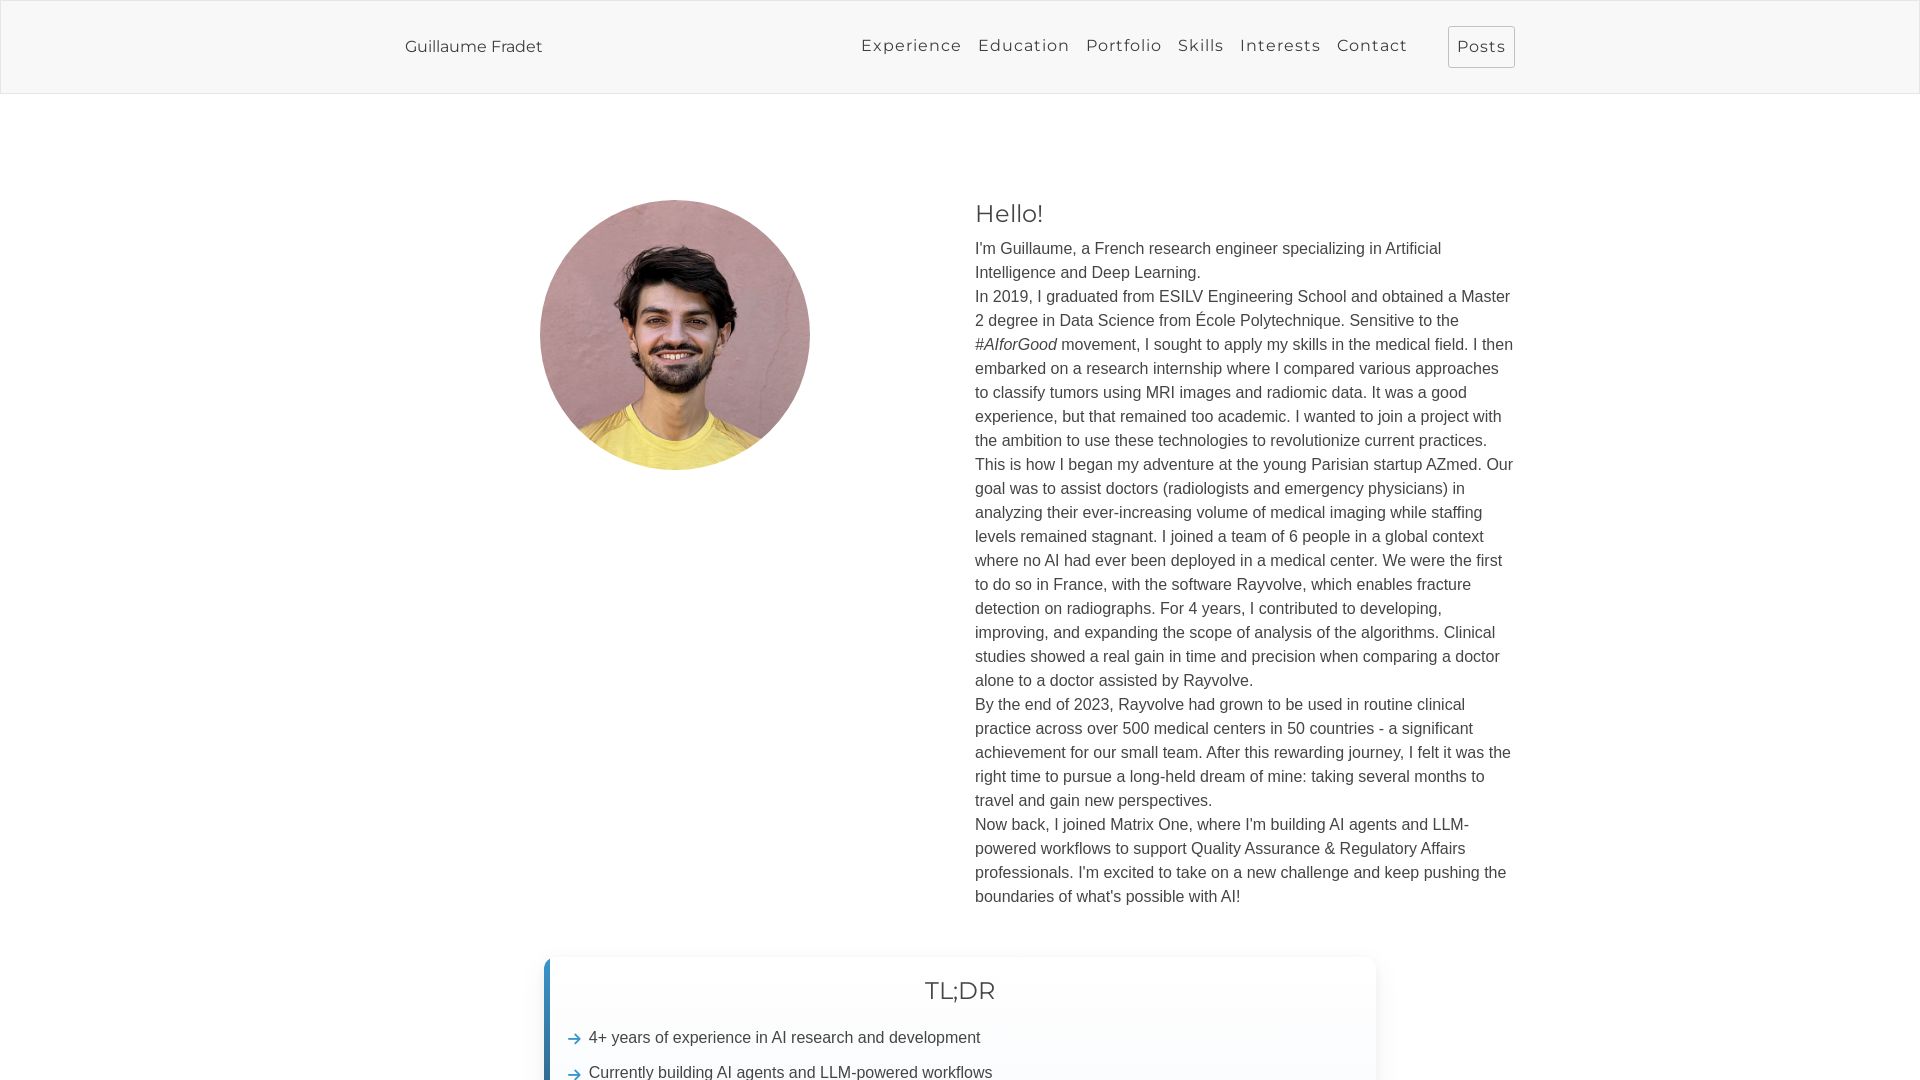
Experienced AI engineer specializing in medical imaging and LLM-powered agents. Built globally deployed radiology AI at AZmed. Now building AI agents at Matrix One.

ℹ️ Curation Disclosure: The overview and features of Grafana were synthesized using AI and fact-checked by our curation team to ensure accuracy.