
OpenObserve
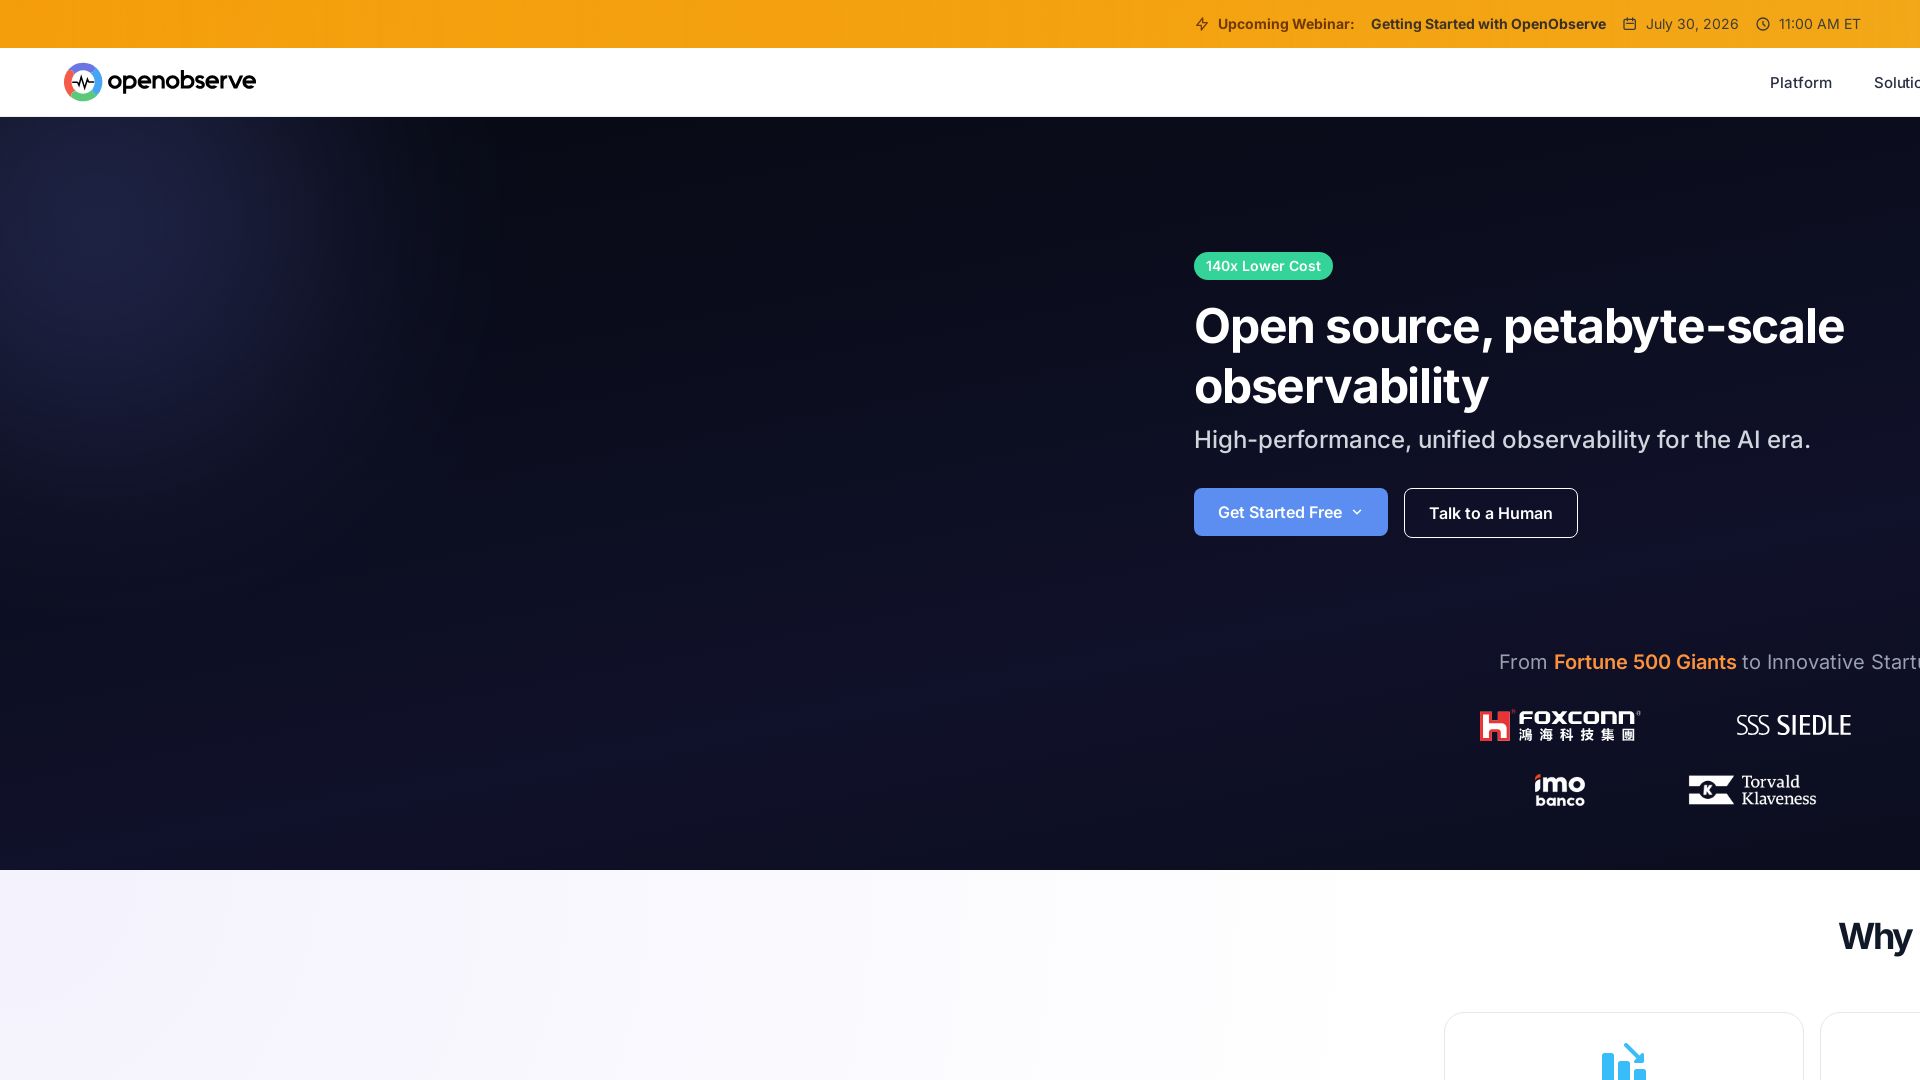
OpenObserve unifies logs, metrics, traces, and RUM in one open source platform. Up to 140x lower cost than Elasticsearch. OpenTelemetry native. Try free.

Editor's Verdict
Key Takeaways
- Unified Observability
- Open Source
- Cost-Effective Storage
- High Performance
In-Depth Review: What is OpenObserve?
OpenObserve is a modern, open source observability platform that unifies logs, metrics, traces, and Real User Monitoring (RUM) into a single solution. Built for performance and efficiency, it leverages Apache Parquet columnar storage to achieve up to 140x lower storage costs than Elasticsearch and 8-10x lower total cost than Datadog. With native OpenTelemetry support, SQL and PromQL query languages, and a single binary deployment, OpenObserve eliminates tool fragmentation and vendor lock-in. Trusted by over 8,000 organizations from startups to Fortune 500 companies, it provides petabyte-scale scalability, blazing fast query performance (1 petabyte in 2 seconds), and a built-in AI SRE agent. Deploy on-premises or in the cloud with your own storage (S3, GCS, Azure Blob). Get started with a free trial or join the upcoming webinar on July 30, 2026.
Core Features
Unified Observability
Combines logs, metrics, traces, and real user monitoring (RUM) into a single platform, eliminating the need for multiple tools.
Open Source
Fully open source under AGPL-3.0 license, allowing community contributions, security audits, and complete control over data.
Cost-Effective Storage
Uses Apache Parquet columnar storage with ~40x compression, achieving up to 140x lower storage costs compared to Elasticsearch.
High Performance
Built with Rust and DataFusion query engine, capable of querying 1 petabyte of data in under 2 seconds.
Scalable Architecture
Stateless node design allows horizontal scaling without data complexity, supporting petabyte-scale deployments.
Open Standards Support
Native OpenTelemetry, SQL, and PromQL support ensures no vendor lock-in and seamless integration with existing tools.
AI-Powered Insights
Built-in AI SRE Agent for automated root cause analysis and natural language querying, reducing mean time to resolution.
Flexible Deployment
Deploy as a single binary or Helm chart on any infrastructure: self-hosted, public cloud, or bring your own cloud.
Pricing
Professional (Cloud)
- Logs, Metrics, Traces, RUM, Session Replay, Error Tracking
- 30-day retention for non-metrics data
- 15-month retention for metrics
- 14-day free trial
Enterprise (Cloud)
- All Professional features
- Additional retention for non-metrics data
- Pipelines and Sensitive Data Redaction
- AI-Powered Observability and AI SRE Agent
- Incident Management
- AI Assistant
- Audit Trail
- Unlimited Users
- Single Sign-On (SSO)
- Role-Based Access Control (RBAC)
- Premium Support
- Deployment flexibility
- Architecture reviews
- Volume discounts
- SLAs
Self-Hosted Enterprise
- SSO, RBAC, Audit Trail
- All core observability features
- Unlimited users
- Volume discounts available
Pros and Cons
Pros
- Cost SavingsUp to 140x lower storage costs than Elasticsearch and 8-10x lower total cost than Datadog, with flat per-GB ingestion pricing and unlimited users.
- Unified PlatformCombines logs, metrics, traces, and RUM in one tool with one query language (SQL/PromQL), eliminating multi-tool fragmentation.
- Open Source & Vendor NeutralFully open source, AGPL-3.0 licensed, with native OpenTelemetry support ensures no lock-in and transparent development.
- High PerformanceBuilt with Rust and DataFusion, enabling fast queries (1 PB in 2 seconds) and efficient resource usage.
- ScalabilityStateless architecture allows horizontal scaling to petabyte-scale without data complexity, proven in Fortune 100 environments.
Cons
- Learning Curve for MigrantsUsers coming from Grafana or Datadog may need time to adapt to OpenObserve's unique query interface and concepts.
- Limited Free Tier FeaturesThe free self-hosted tier (up to 50 GB/day) lacks advanced features like SSO, RBAC, and audit trail, which require Enterprise plan.
- Relatively Newer in MarketCompared to established vendors like Datadog or Splunk, OpenObserve has a smaller ecosystem and fewer third-party integrations.
- Self-Hosted Operational OverheadRunning OpenObserve on-premises or on your own cloud requires management of infrastructure, upgrades, and backups.
- Usage-Based Pricing VariabilityCosts are tied to ingestion volume, which can be unpredictable for peak loads, though flat per-GB pricing helps.
Use Cases & Recommended Professions
DevOps Engineer→ View Toolkit
Needs a unified observability platform to monitor microservices and infrastructure without managing multiple tools.
Site Reliability Engineer (SRE)→ View Toolkit
Requires high-performance, cost-effective monitoring for incident response and root cause analysis.
Platform Engineer→ View Toolkit
Benefits from an open-source, scalable observability stack that integrates with existing infrastructure.
Software Engineer→ View Toolkit
Uses logs, traces, and metrics to debug applications and optimize performance in development and production.
CTO/VP of Engineering→ View Toolkit
Seeks to reduce observability costs and simplify tooling across the organization.
IT Operations Manager→ View Toolkit
Needs a unified view of system health, alerts, and user experience to ensure uptime and SLAs.
Frequently Asked Questions
Alternative AI Tools
View Detailed Comparison →
Datadog
Explore Datadog docs for infrastructure, APM, logs, security, digital experience, and AI observability. Get started with integrations and agents.

Datadog
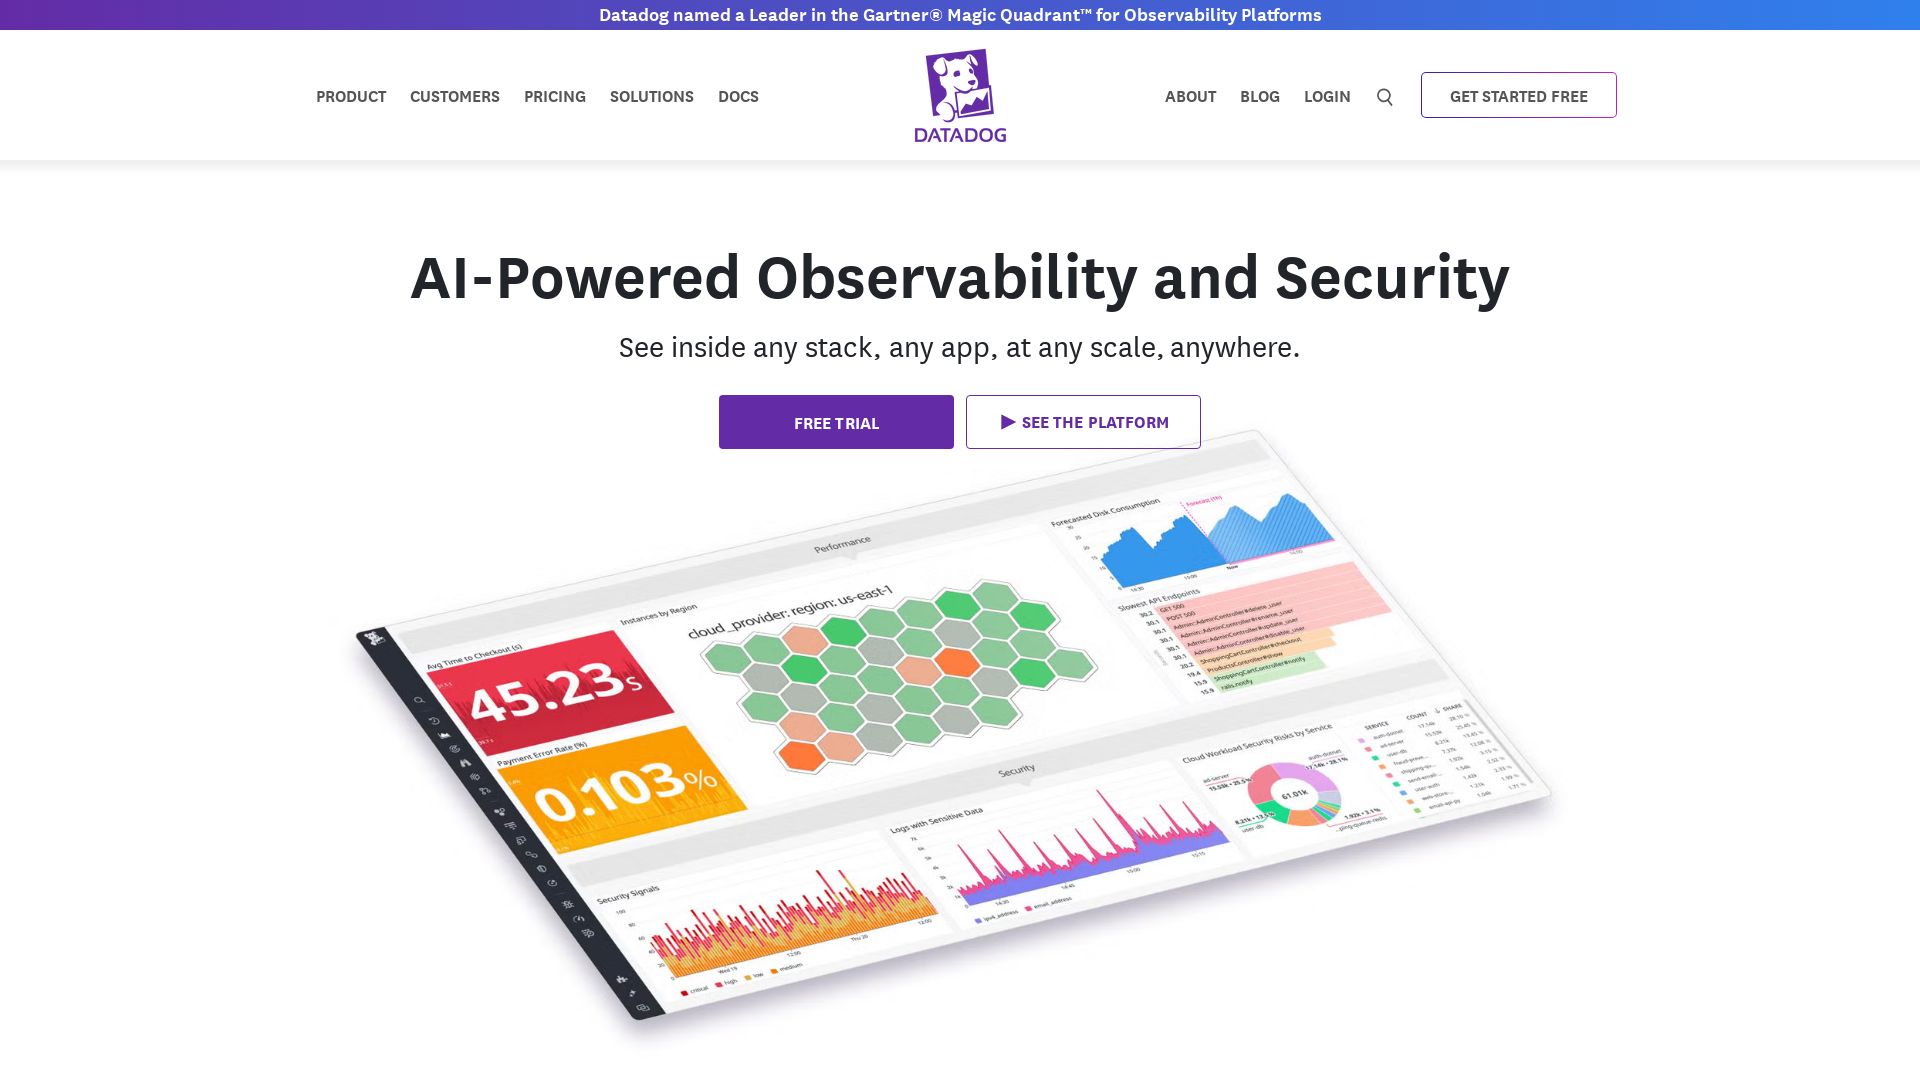
See inside any stack, any app, at any scale, anywhere. Named a Leader in Gartner® Magic Quadrant™ for Observability Platforms 2026. Start free trial.
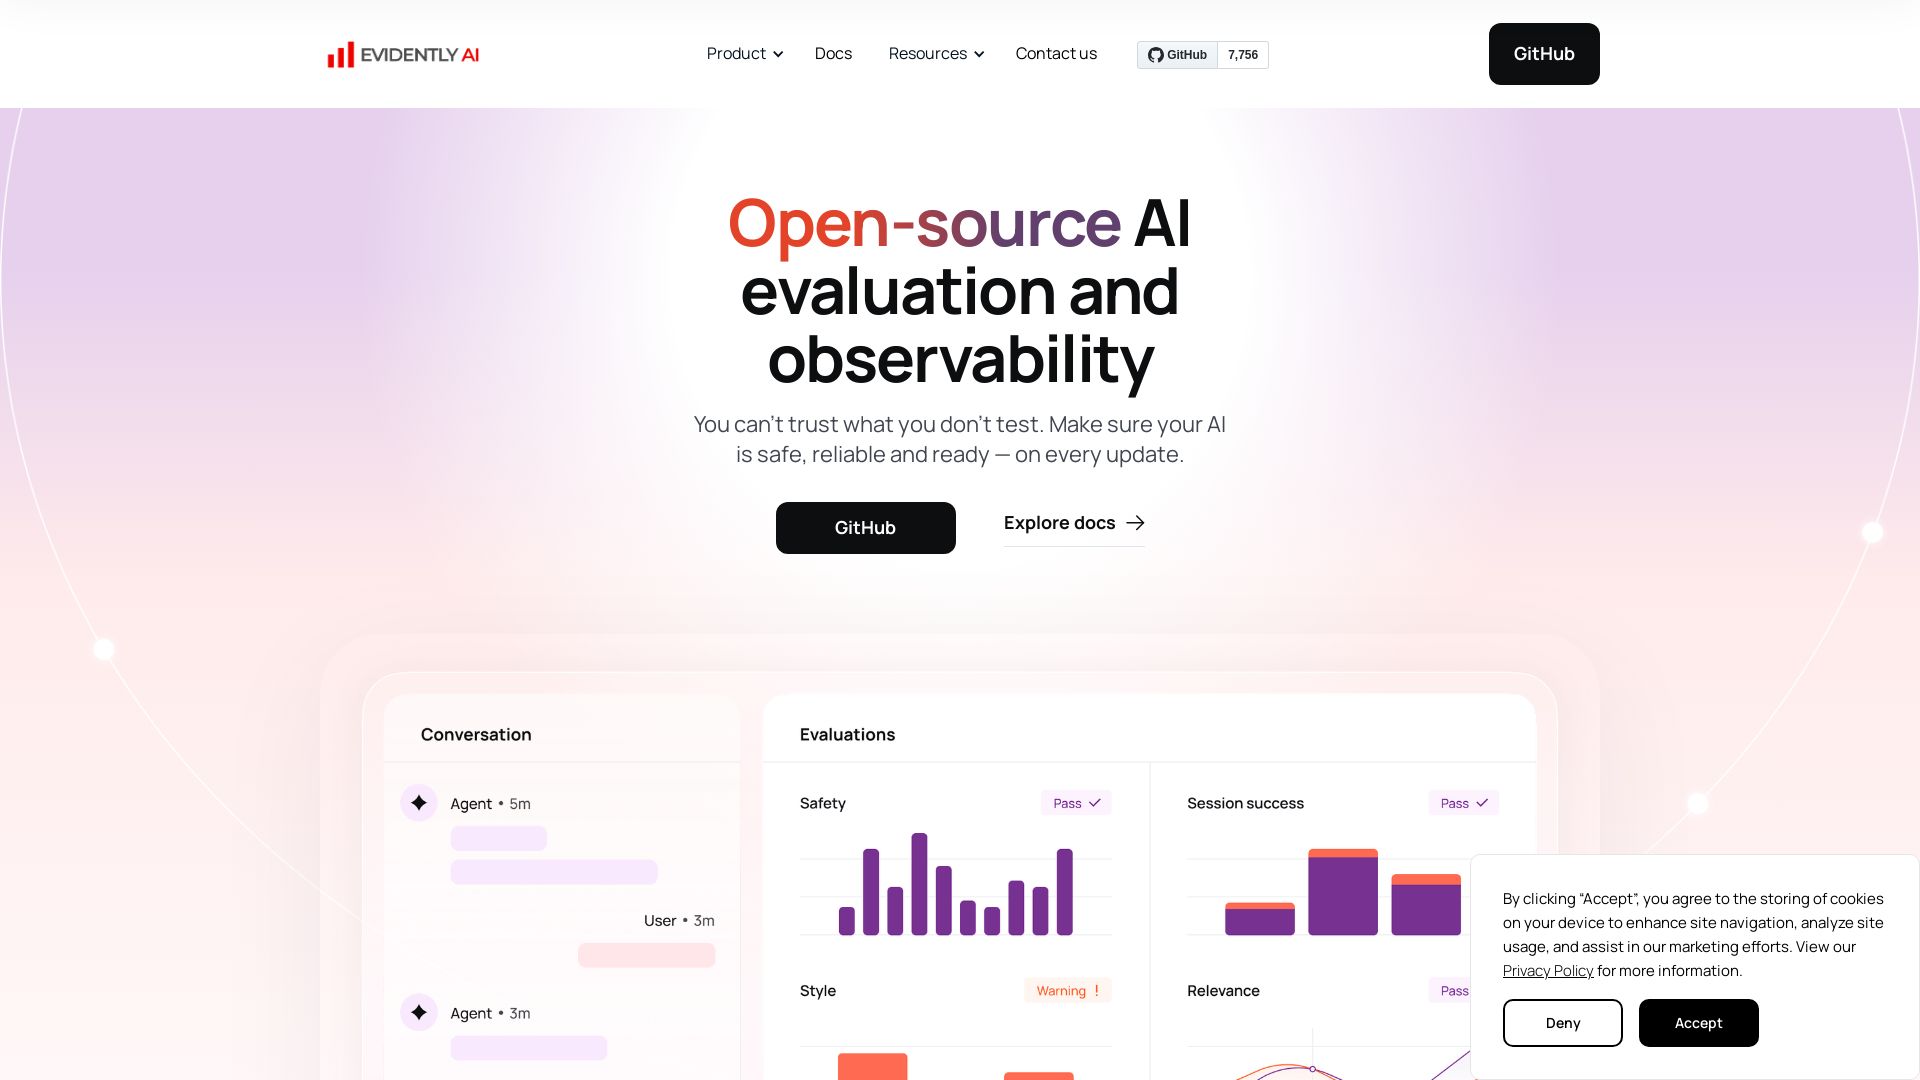
Evidently AI
Evaluate, test, and monitor LLMs, RAG, AI agents, and ML models. Open-source framework to ensure AI safety, reliability, and performance.

Grafana
Unify metrics, logs, traces & profiles. Cut costs with Adaptive Telemetry. Built-in AI helps you troubleshoot faster. Trusted by Fortune 500. Get started free.

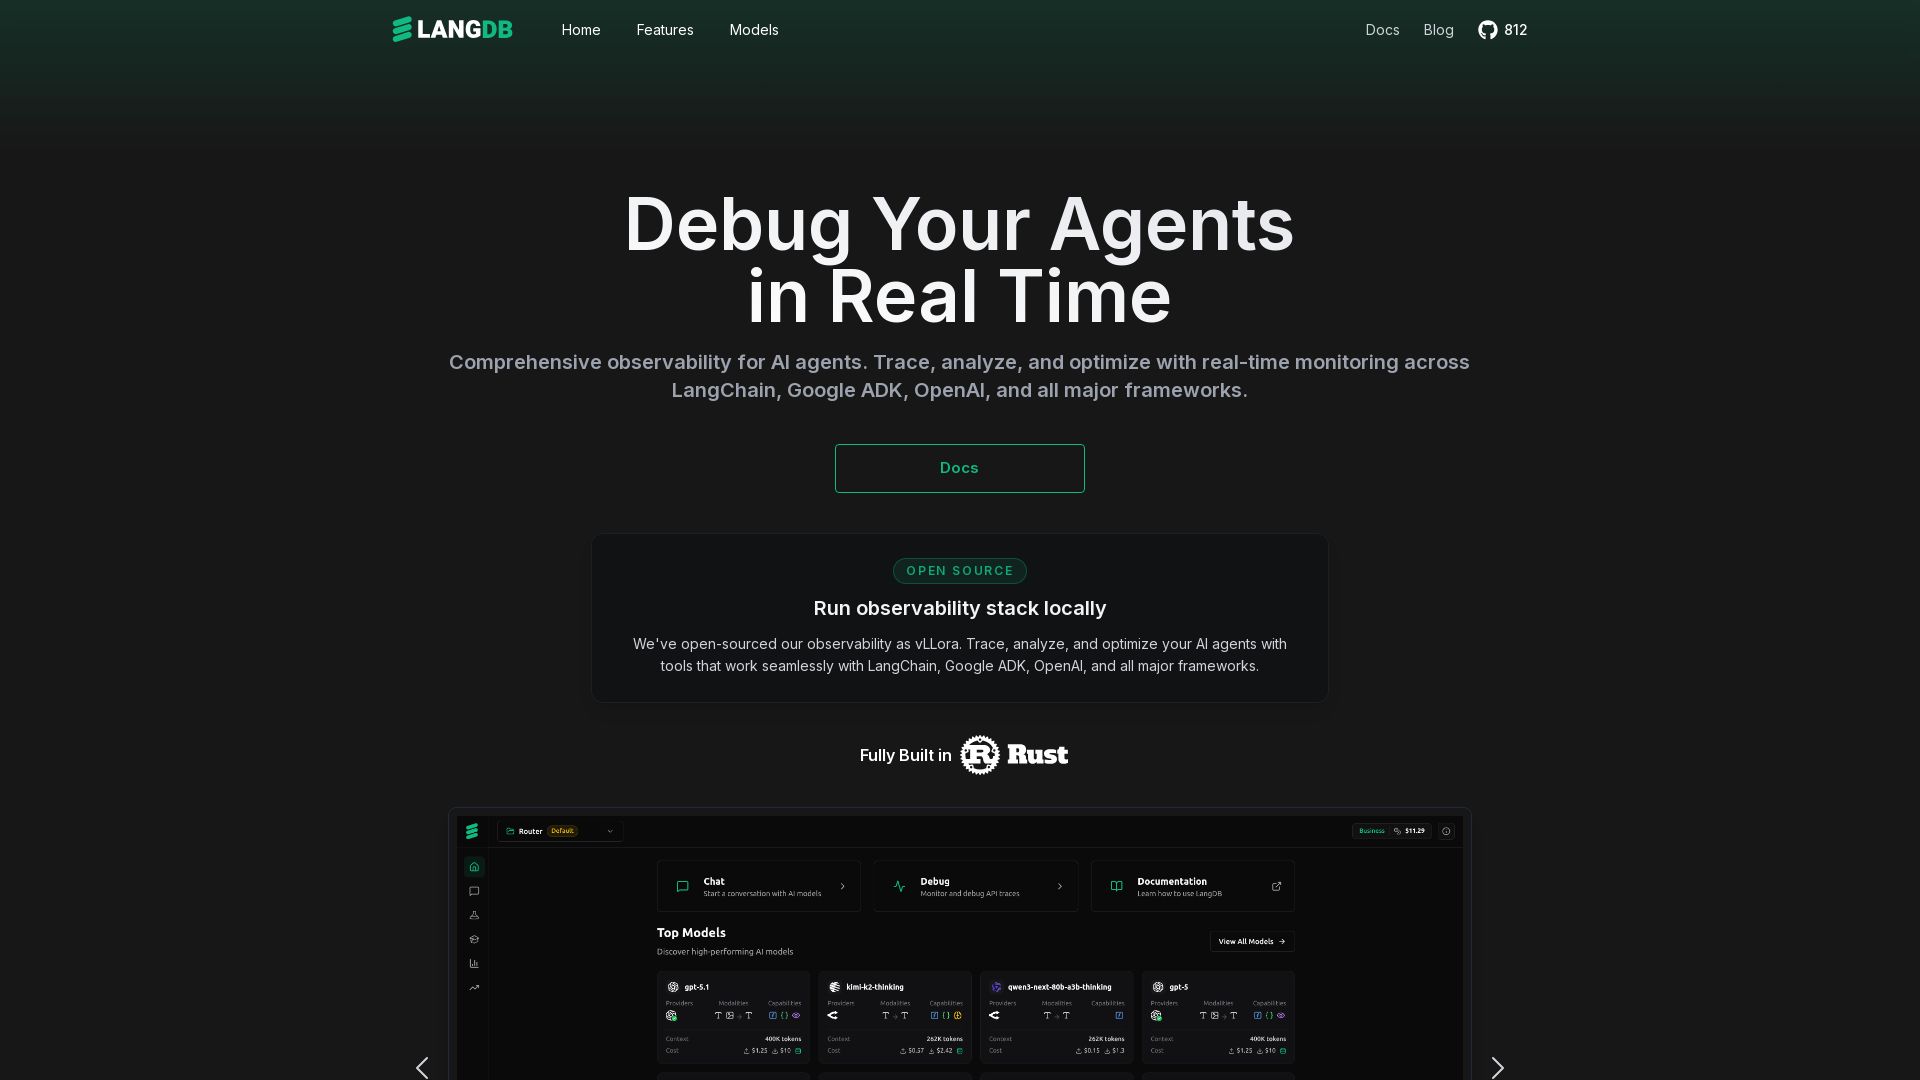
LangDB
Comprehensive observability for AI agents. Trace, analyze, and optimize with real-time monitoring across all major LLM frameworks. Unified API for 250+ models.

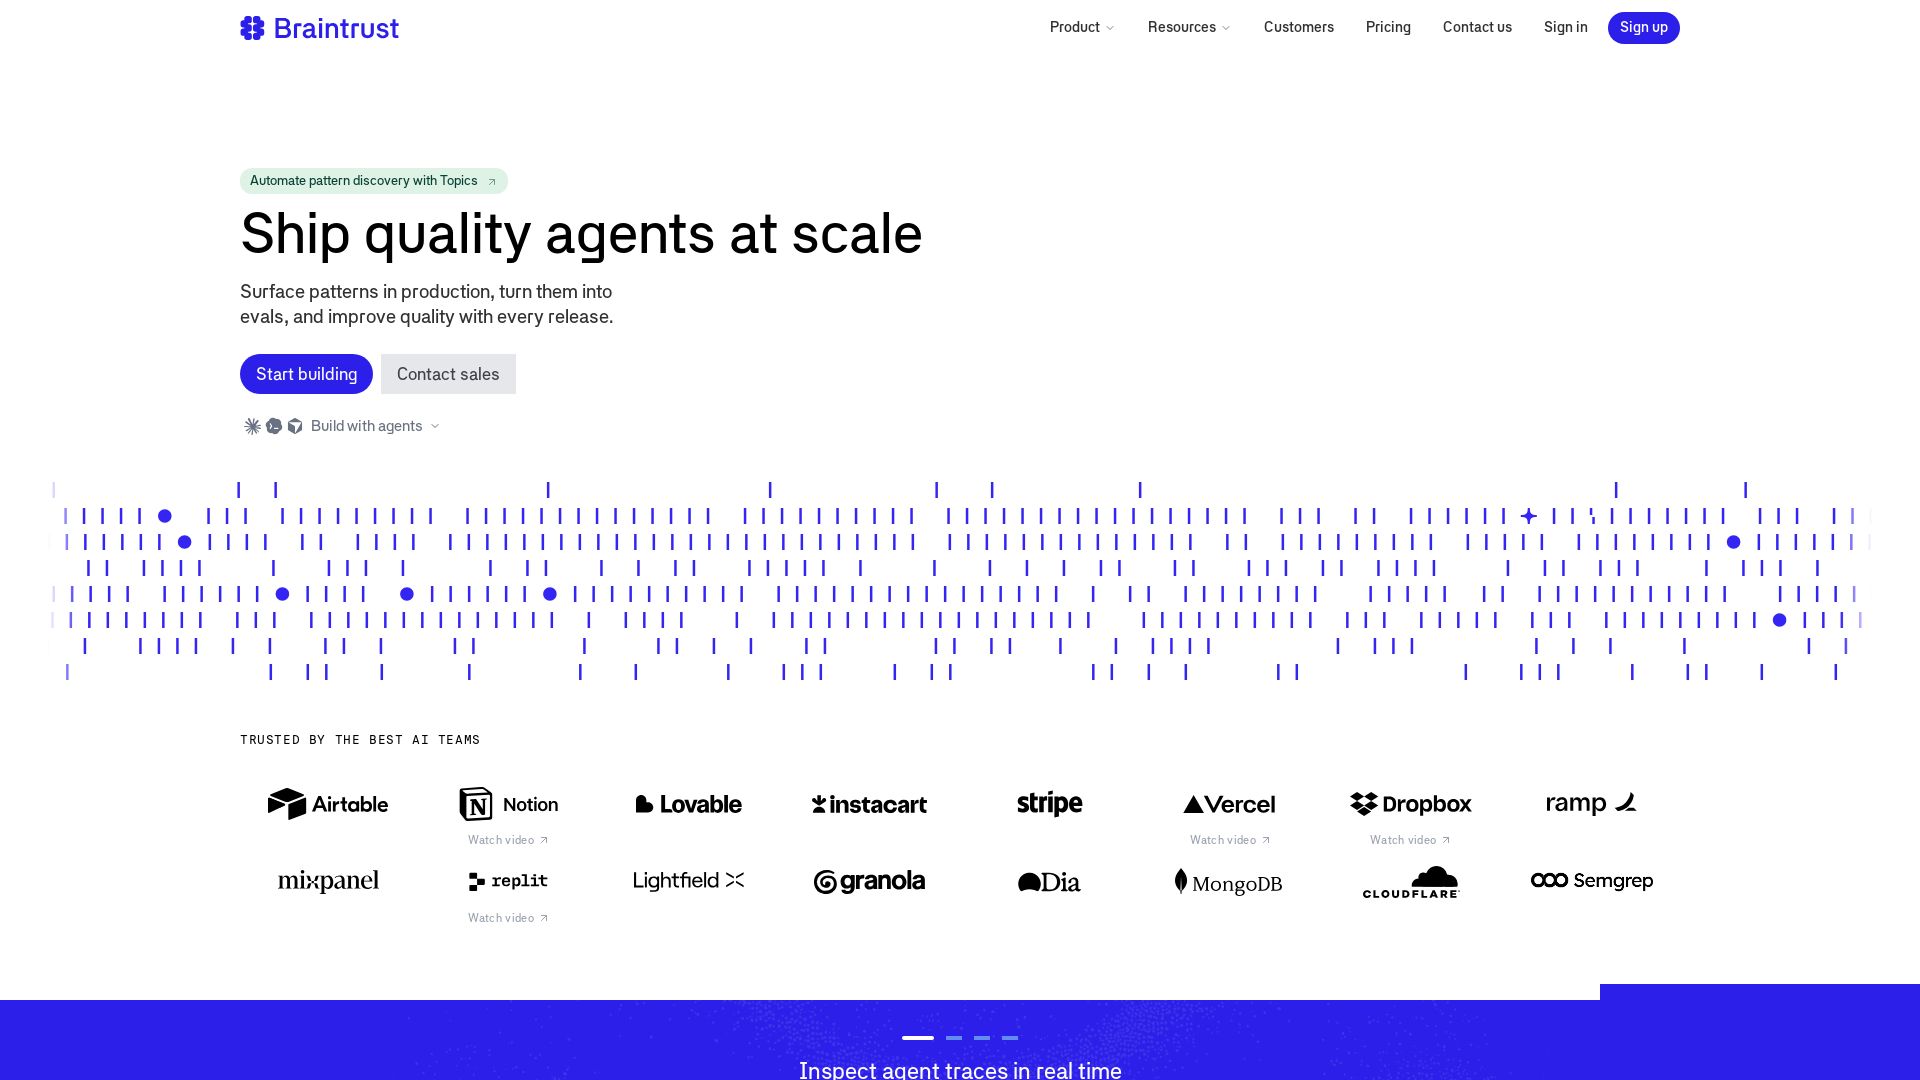
Braintrust
Trace, evaluate, and discover patterns in AI agents. Ship quality agents at scale with real-time observability, evals, and automatic pattern discovery.

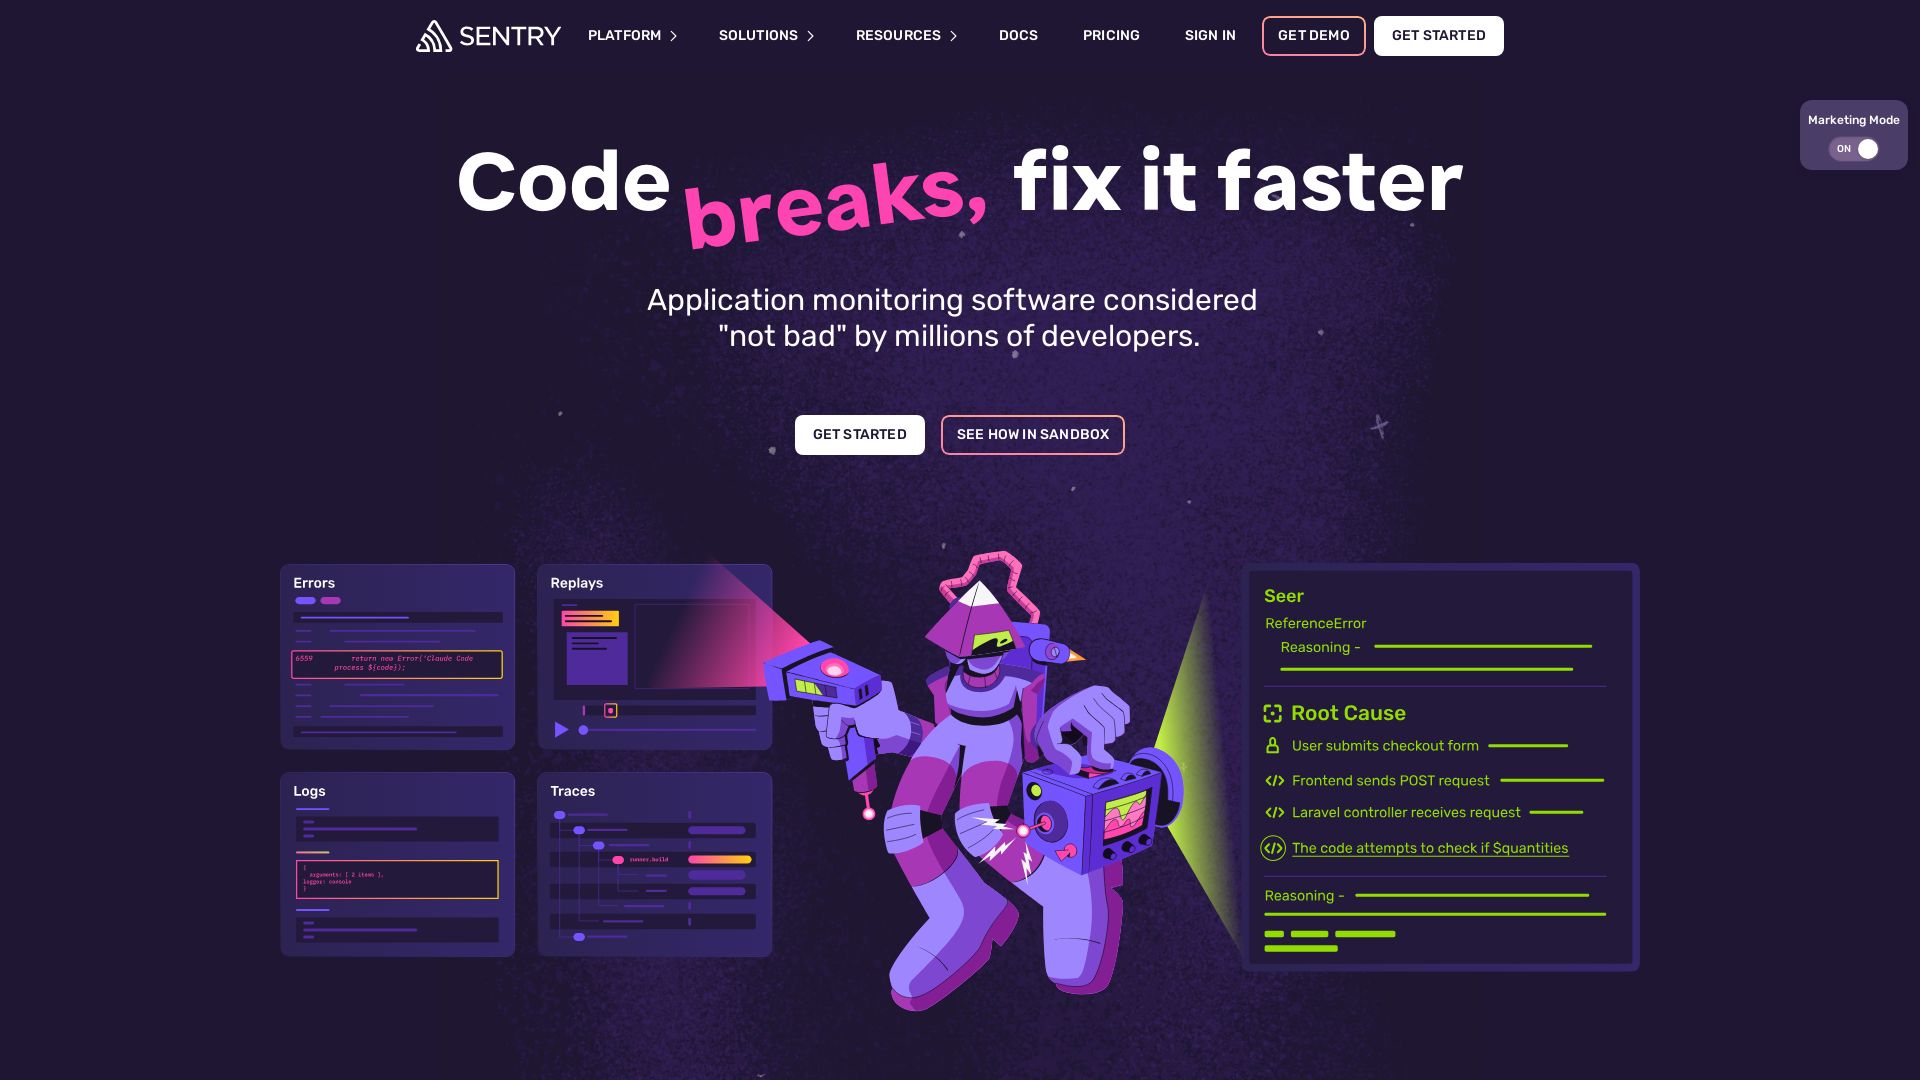
Sentry
Fix code faster with Sentry's AI-powered debugging, error monitoring, and tracing. Get started in 5 lines. Loved by millions.

zircote
Explore insights on backend architecture, AI development, observability, and regenerative agriculture by technologist Robert Allen.
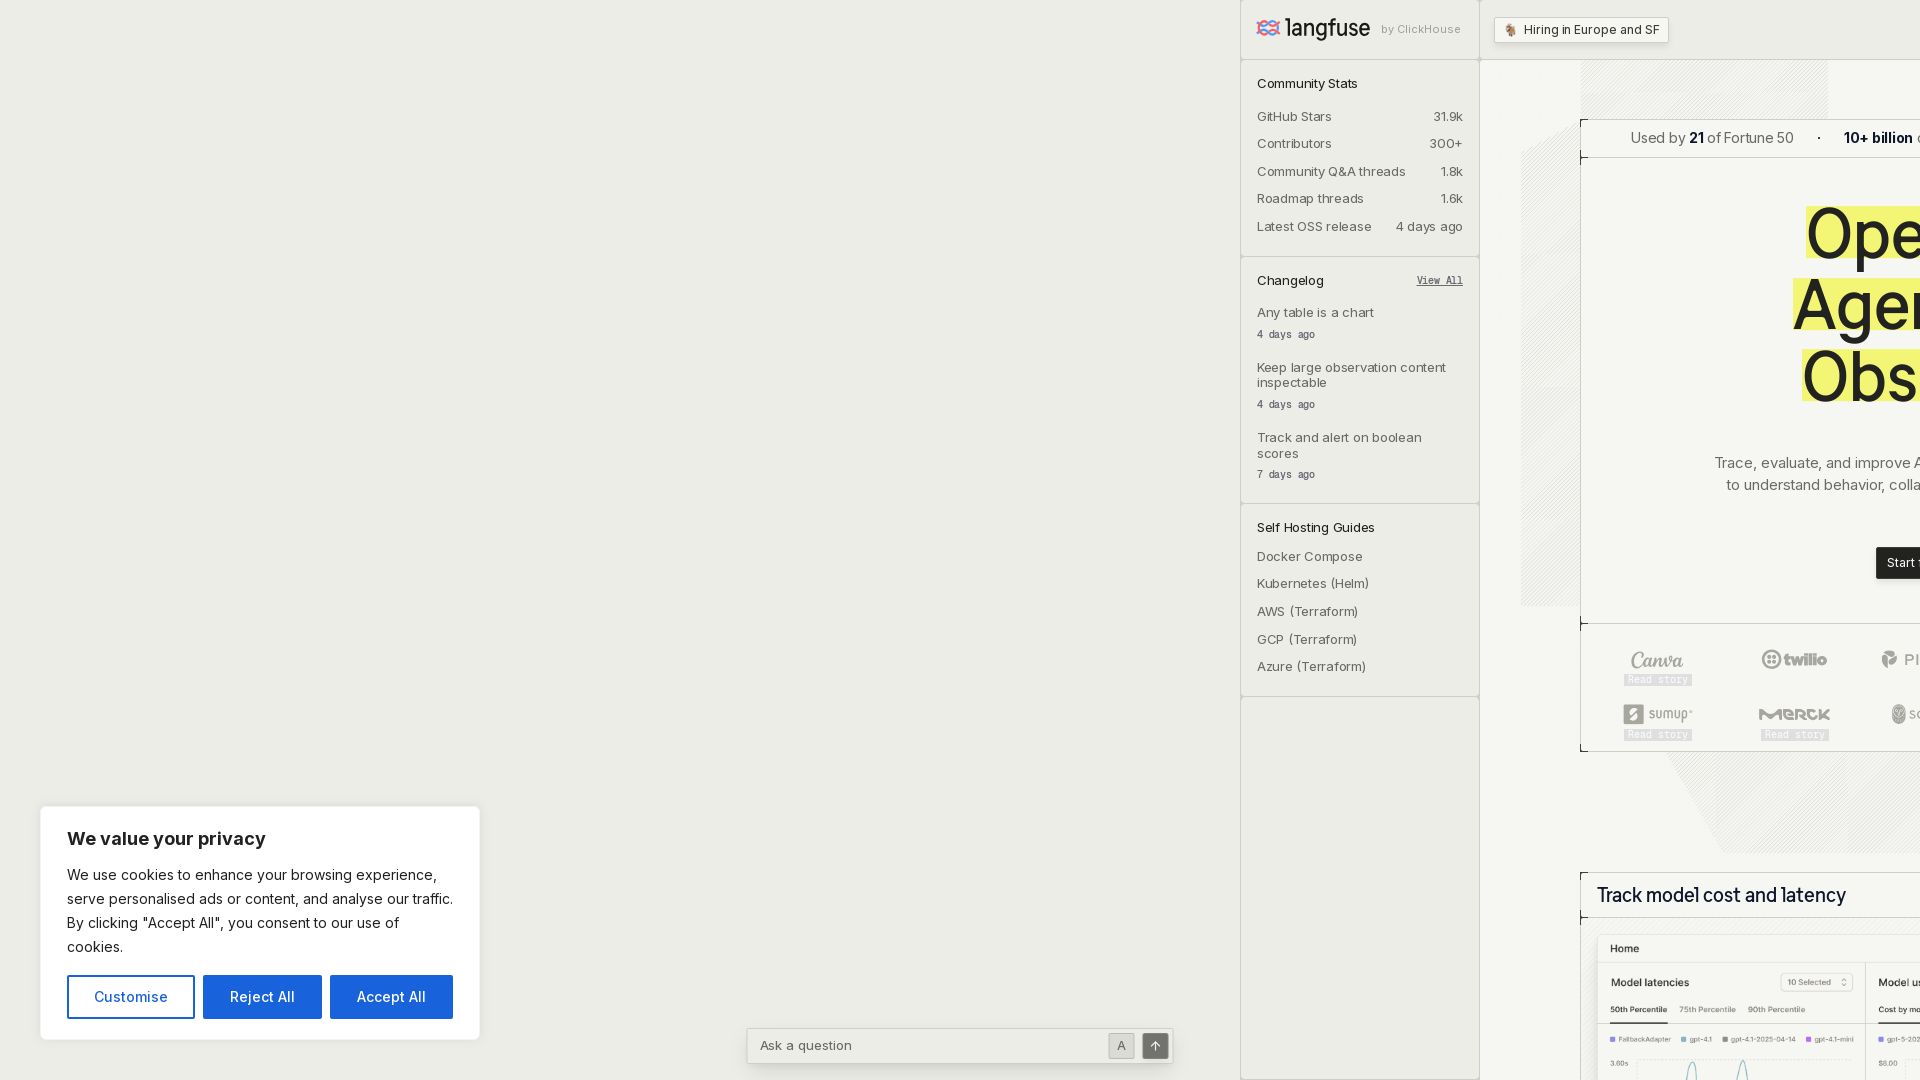
Langfuse
Trace, evaluate, and improve AI agents with one open platform. Use production data to optimize cost, latency, and quality.

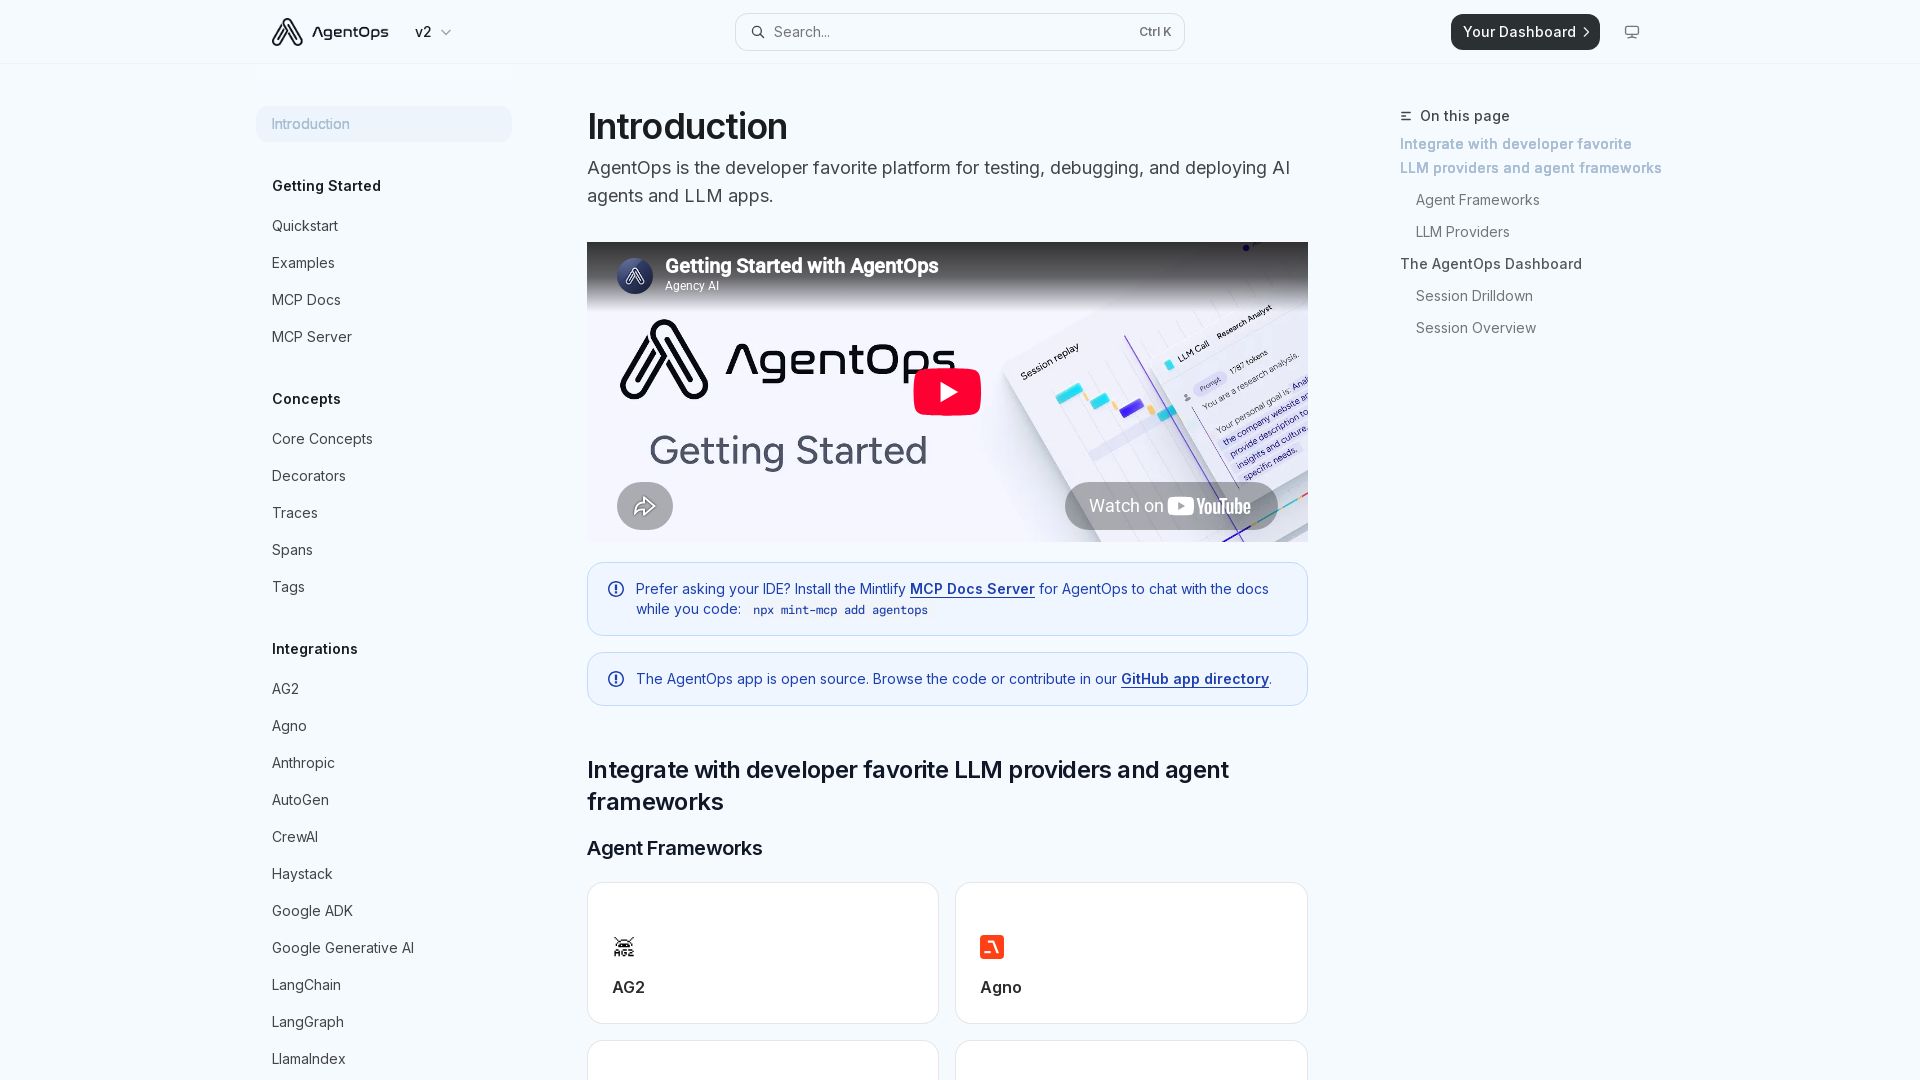
AgentOps
The developer favorite platform for testing, debugging, and deploying AI agents and LLM apps. Two lines of code for full observability.

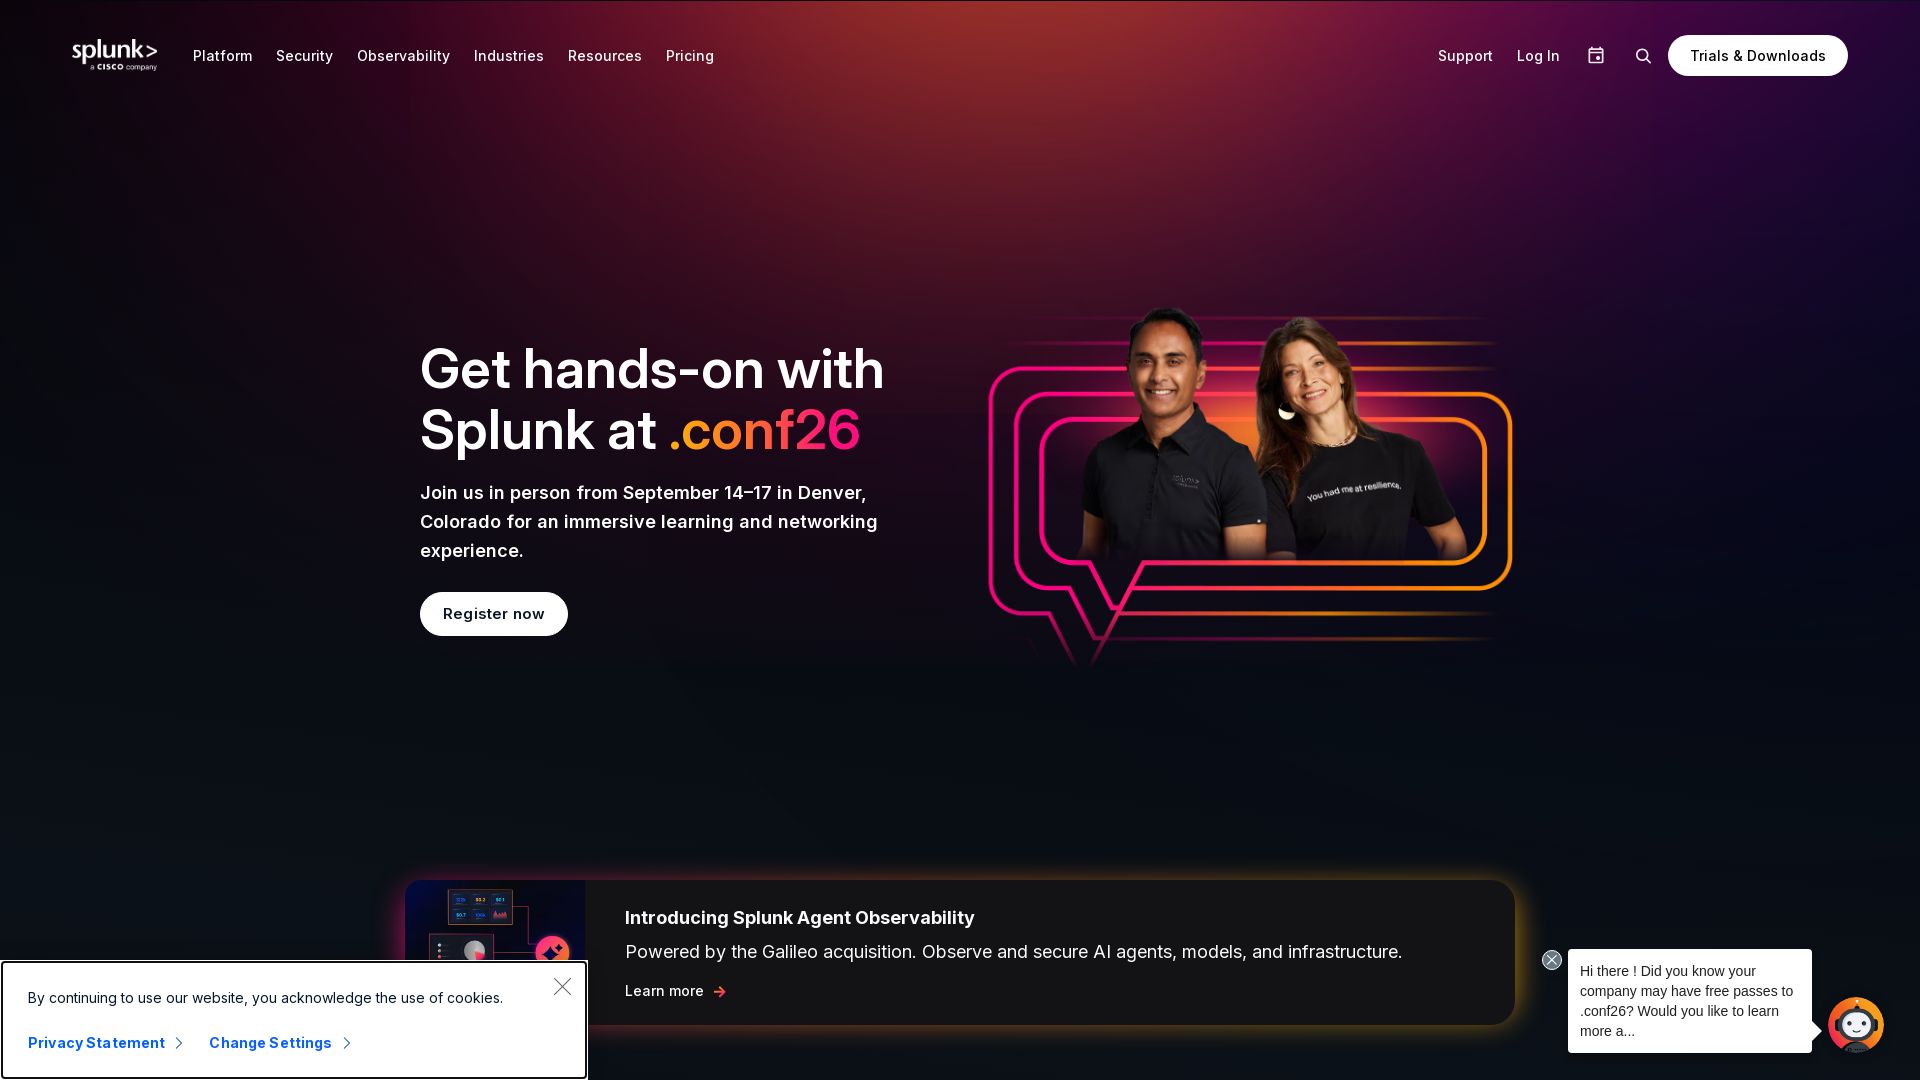
Splunk
Trusted by global leaders, Splunk's AI-powered platform delivers real-time threat detection, observability, and digital resilience at scale.
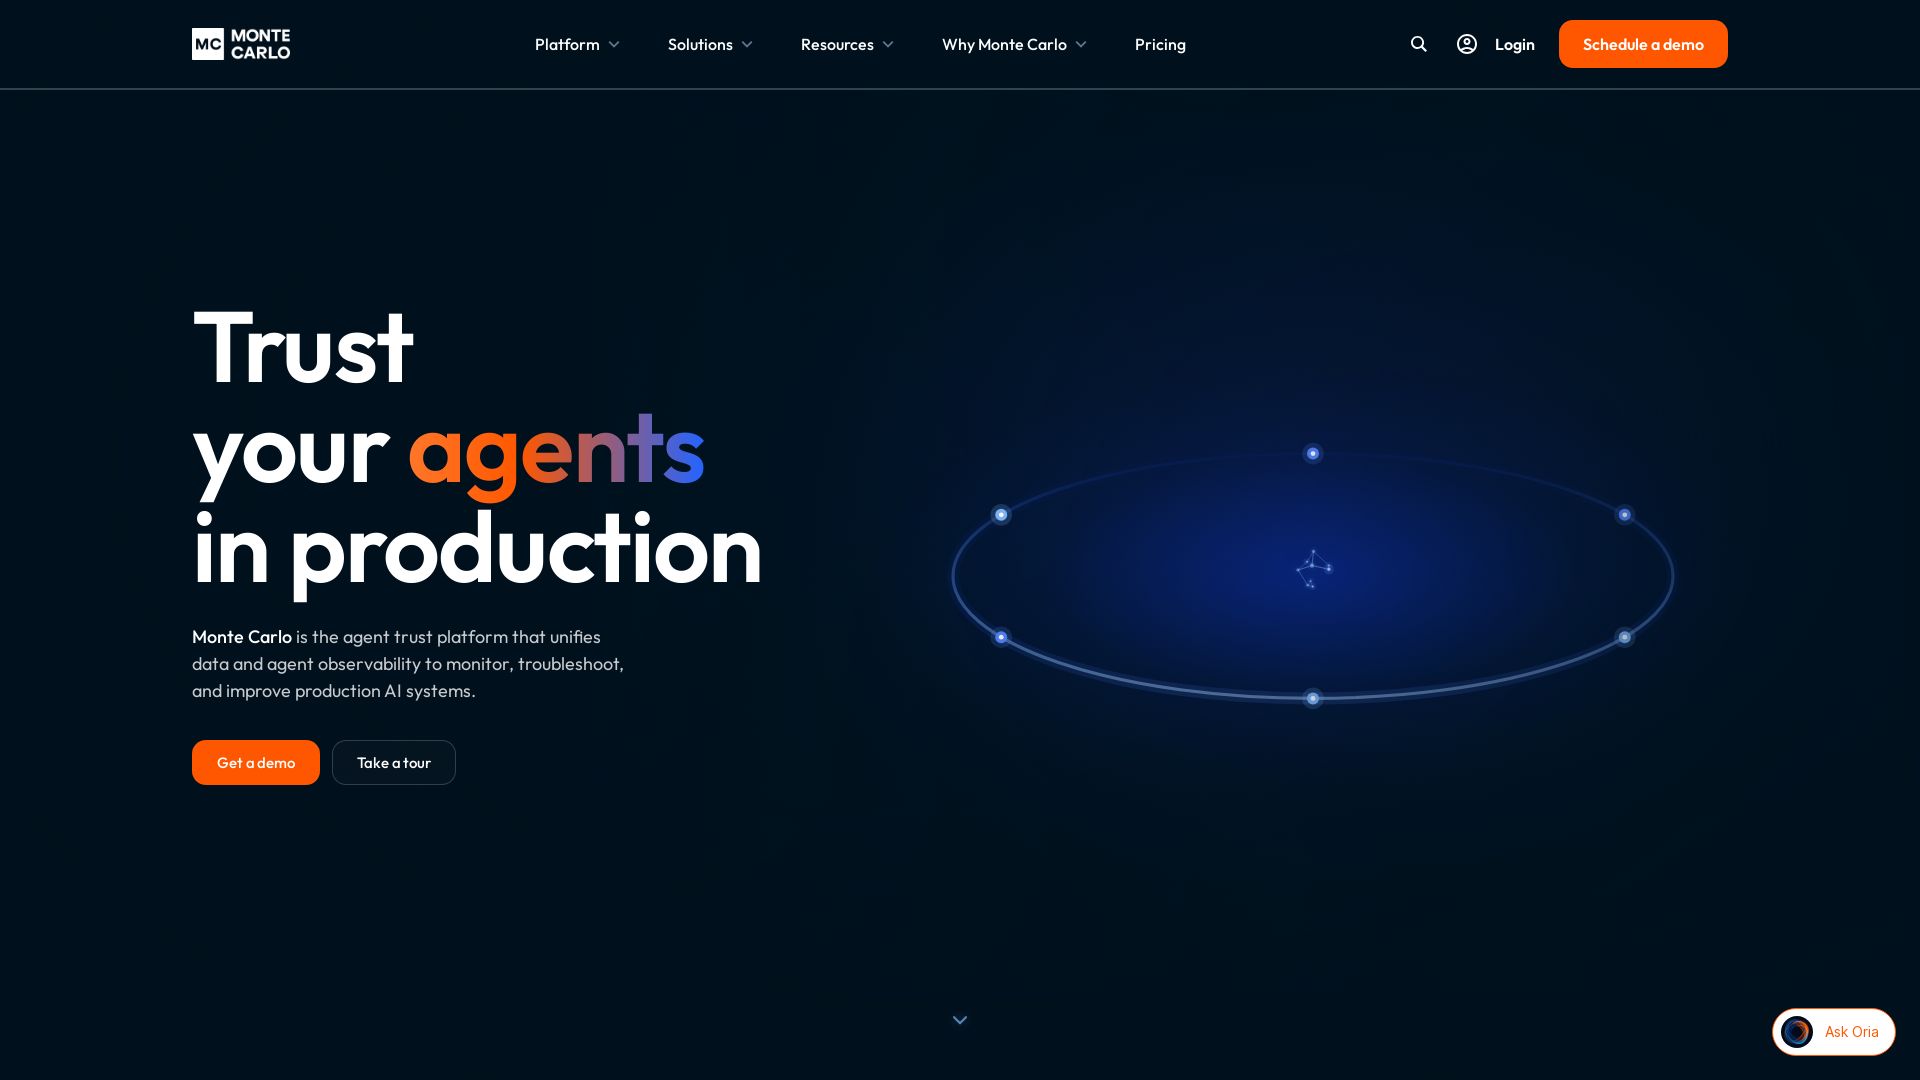
Monte Carlo
The agent trust platform that unifies data and agent observability for production AI systems. Trusted by 400+ enterprises.

ℹ️ Curation Disclosure: The overview and features of OpenObserve were synthesized using AI and fact-checked by our curation team to ensure accuracy.