
ChartGen AI
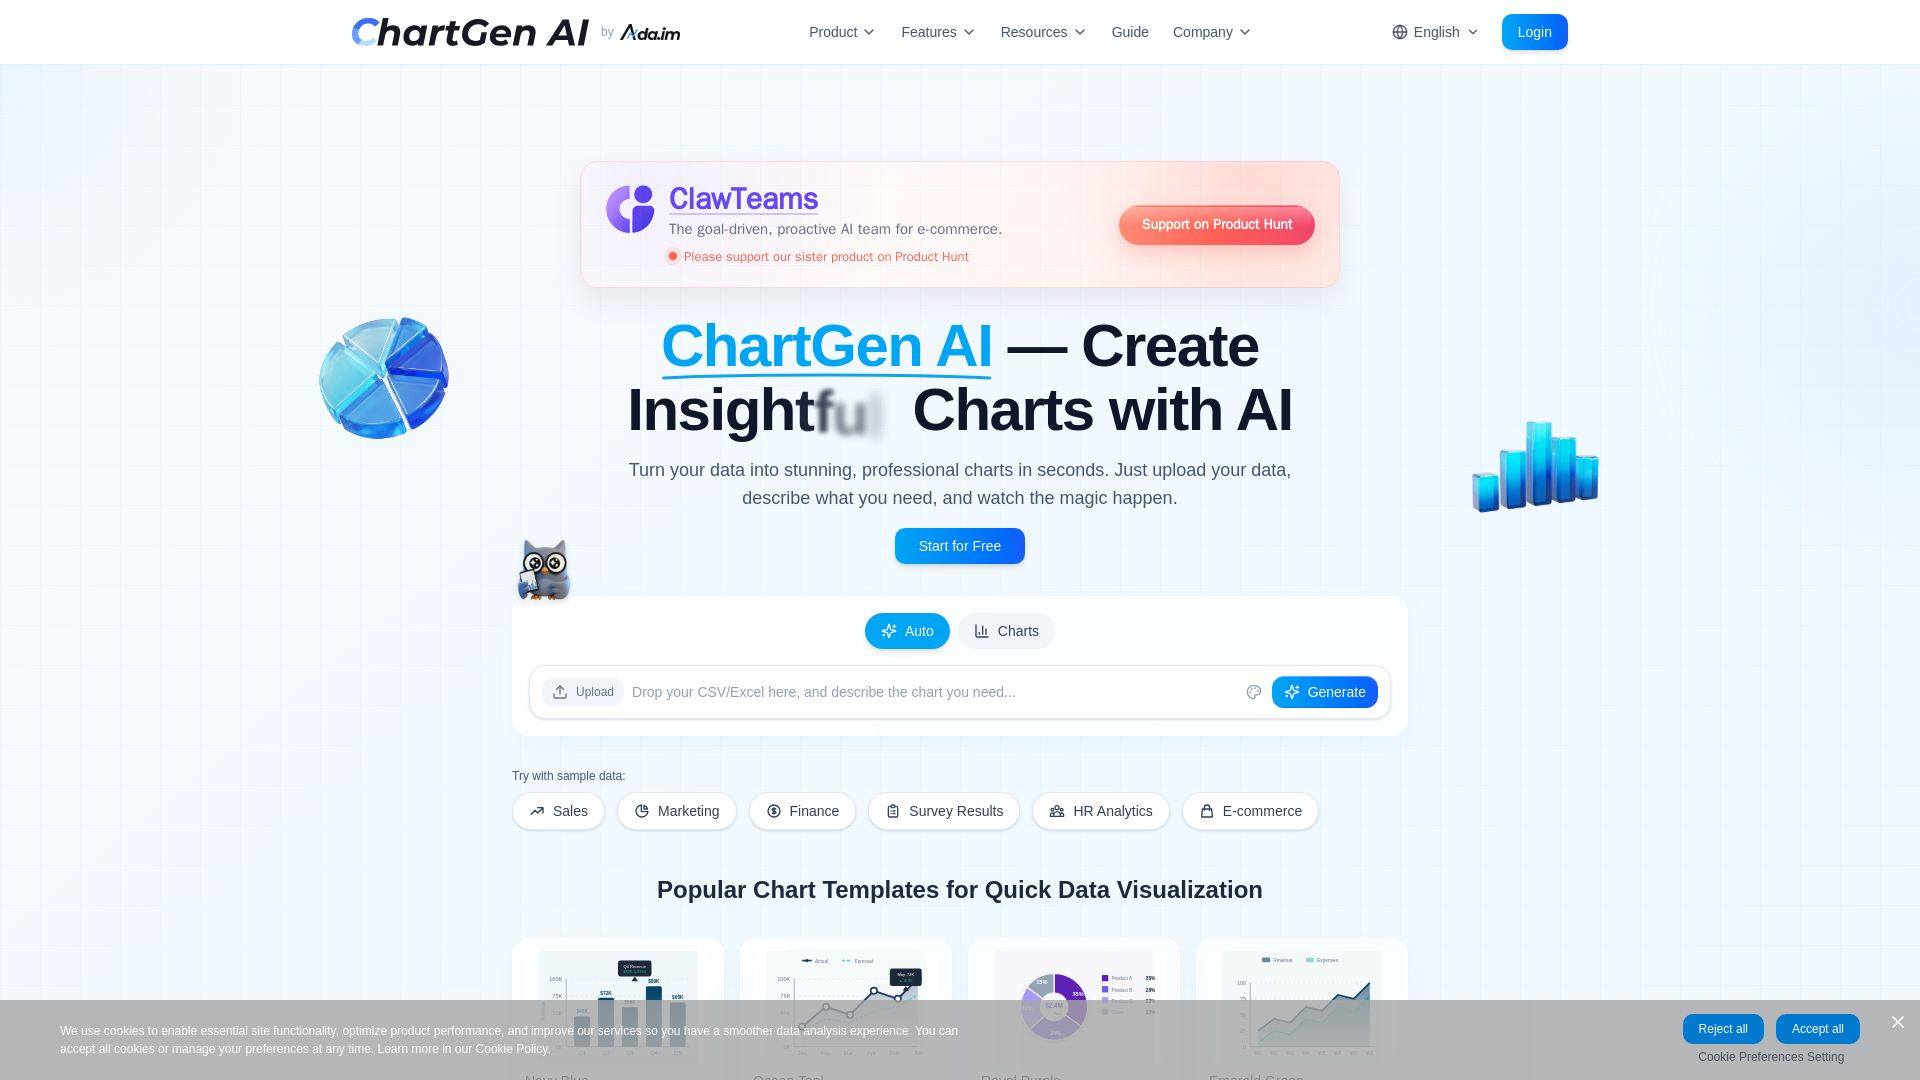
Turn data into beautiful charts in seconds. Upload CSV/Excel, describe in plain English, get professional visualizations. Free tier available. Try now!
Editor's Verdict
Key Takeaways
- Instant AI Chart Generation
- Natural Language Chart Creation
- Multiple Chart Types Supported
- Live Data Synchronization
In-Depth Review: What is ChartGen AI?
ChartGen AI is an AI-powered chart generator that transforms your data into professional visualizations in seconds. Simply upload your CSV or Excel file, describe the chart you want in natural language, and get stunning bar, line, pie, and more. Supports 9+ chart types, 12 color themes, live data sync, and export to PNG, SVG, or PDF. Trusted by 50,000+ active users and 1,200+ companies. Ideal for finance, marketing, and business reporting. Start with 50 free charts per month, no credit card required.
Core Features
Instant AI Chart Generation
Create professional data visualizations in seconds by simply describing your data.
Natural Language Chart Creation
No complex tools or coding required; describe what chart you want in plain English.
Multiple Chart Types Supported
Bar charts, line charts, pie charts, scatter plots, heatmaps, funnels, waterfalls, and more.
Live Data Synchronization
Connect to data sources for real-time updates; charts refresh automatically.
Export Charts Anywhere
Download as PNG, SVG, or PDF; embed into presentations, reports, and dashboards.
Enterprise-Ready Security
SOC 2 compliant with end-to-end encryption; data stays secure and private.
Pricing
Starter
- Up to 2 data sources with basic merging
- Supports all output types
- Export in high resolution without watermarks
- Up to 15 PPT pages
- File download supported
- UI editing supported
- Up to 2 concurrent tasks
- Extended storage space
- Extended history retention
Growth
- Up to 3 data sources with basic merging
- Supports all output types
- Export in high resolution without watermarks
- Up to 20 PPT pages
- File download supported
- UI editing supported
- Up to 3 concurrent tasks
- Extended storage space
- Extended history retention
Plus
- Up to 5 data sources with cross-source comparison
- Supports all output types
- Export in high resolution without watermarks
- Up to 20 PPT pages
- Parallel multi-task execution
- Scheduled task support
- Multiple concurrent sessions
- Medium storage capacity
- Project-level content management
Pro
- 20+ integrated sources with cross-system aggregation
- Supports all output types
- Export in high resolution without watermarks
- No PPT page limit
- Commercial license included
- High throughput concurrent + batch generation
- Multiple projects in parallel
- Large capacity + project isolation
- Long-term data archiving
- Usage analysis & audit logs
- API access supported
Pros and Cons
Pros
- Fast AI GenerationCreates charts in seconds from natural language descriptions, saving time.
- User-FriendlyNo coding or design skills needed; easy for non-technical users.
- Wide Chart VarietySupports 9+ professional chart types to suit various data needs.
- Export FlexibilityCharts can be exported as PNG, SVG, or PDF and embedded.
- Enterprise SecuritySOC 2 compliant with encryption, ensuring data privacy.
Cons
- Limited Free TierFree plan offers only 50 charts per month and limited features.
- File Format ConstraintsOnly supports CSV and Excel files for data import.
- Credit SystemUsage is tracked via credits, which may be confusing for some users.
- No Offline ModeRequires internet connection to generate charts.
- Learning Curve for Advanced FeaturesSome features like cross-source analysis may require learning.
Use Cases & Recommended Professions
Data Analyst→ View Toolkit
Needs to quickly create visualizations for reports and presentations without manual chart building.
Marketing Manager→ View Toolkit
Requires fast, attractive charts to analyze campaign performance and share insights with stakeholders.
Financial Analyst→ View Toolkit
Needs to generate quarterly reports and revenue analysis charts efficiently.
Business Intelligence Analyst→ View Toolkit
Uses AI-generated charts to visualize complex datasets and support decision-making.
Project Manager→ View Toolkit
Leverages Gantt charts and dashboards to track project progress and communicate with teams.
Executive / CEO→ View Toolkit
Needs clear, professional visuals to present data-driven strategies to board members.
Frequently Asked Questions
Alternative AI Tools
View Detailed Comparison →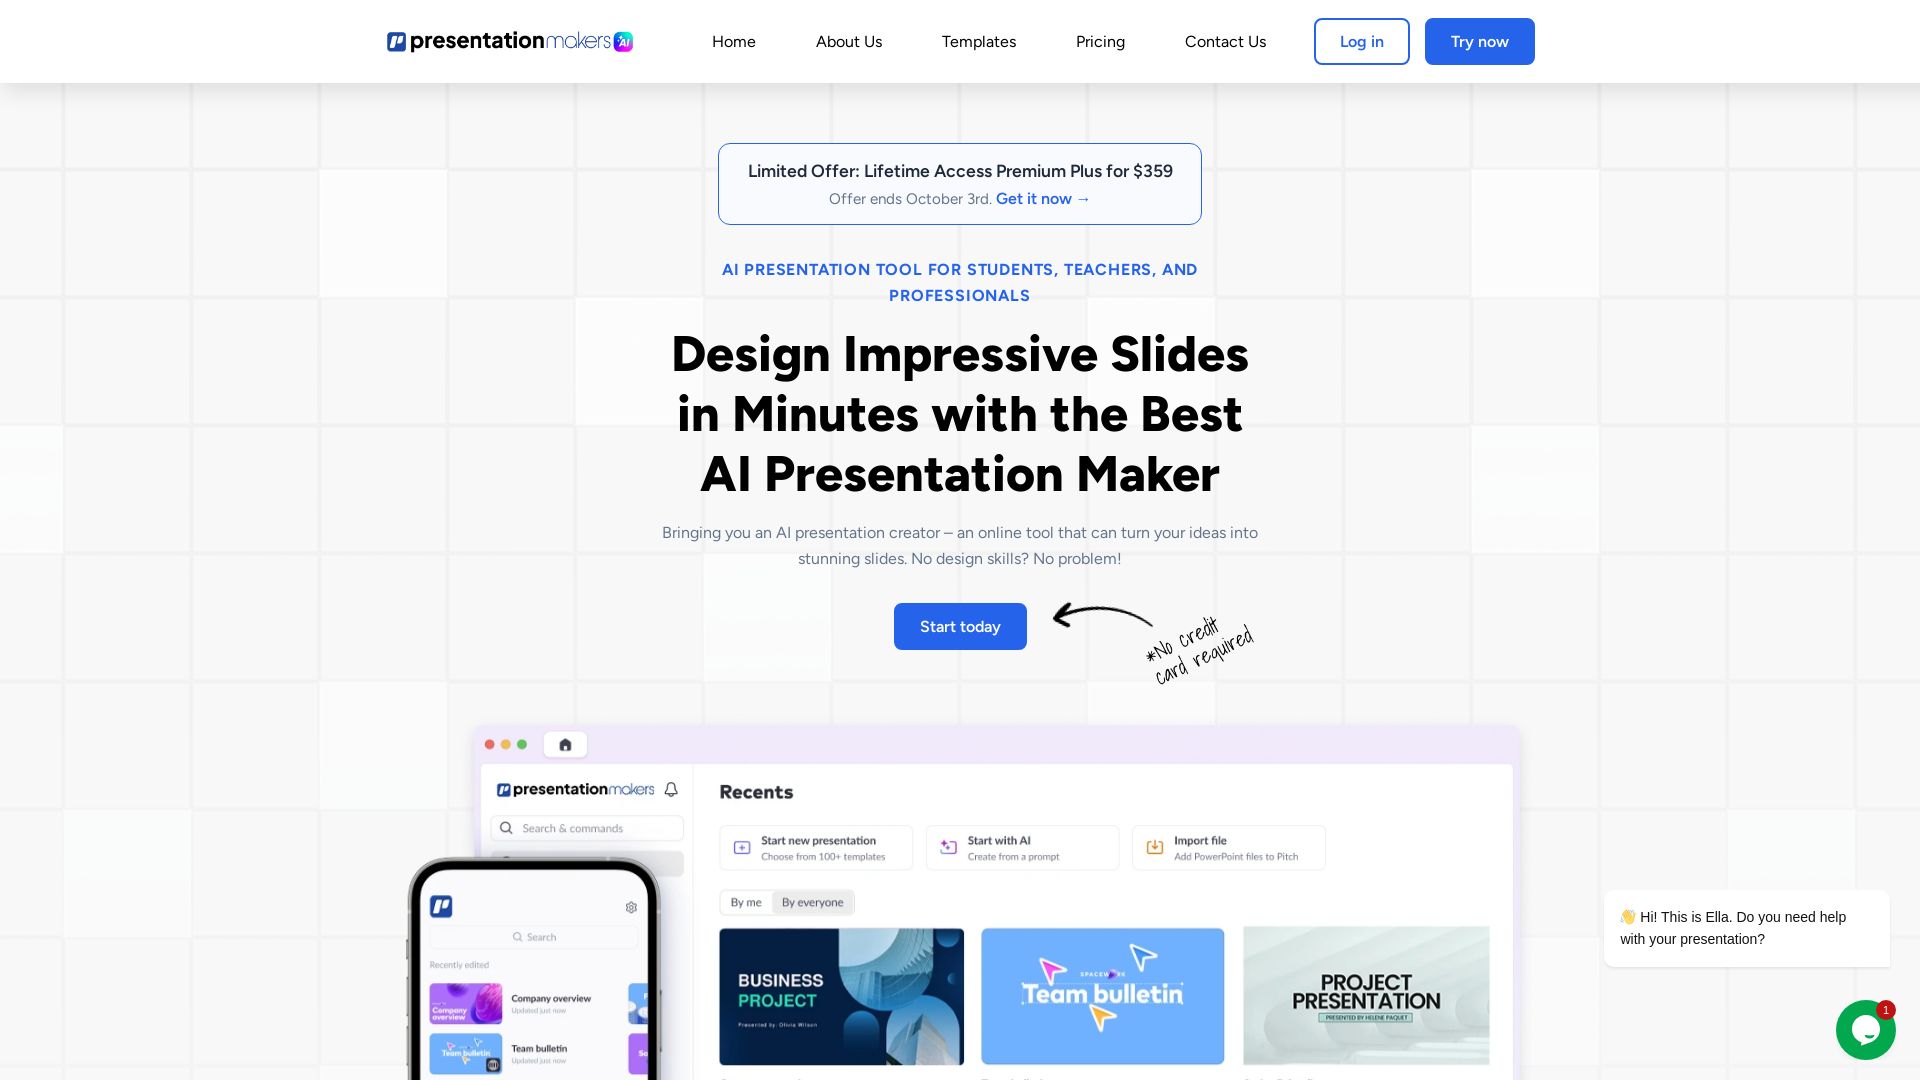
Presentation Maker AI
Create professional presentations in minutes with our AI presentation maker. Ideal for students, teachers, and businesses. No design skills needed. Try free!

PrometAI
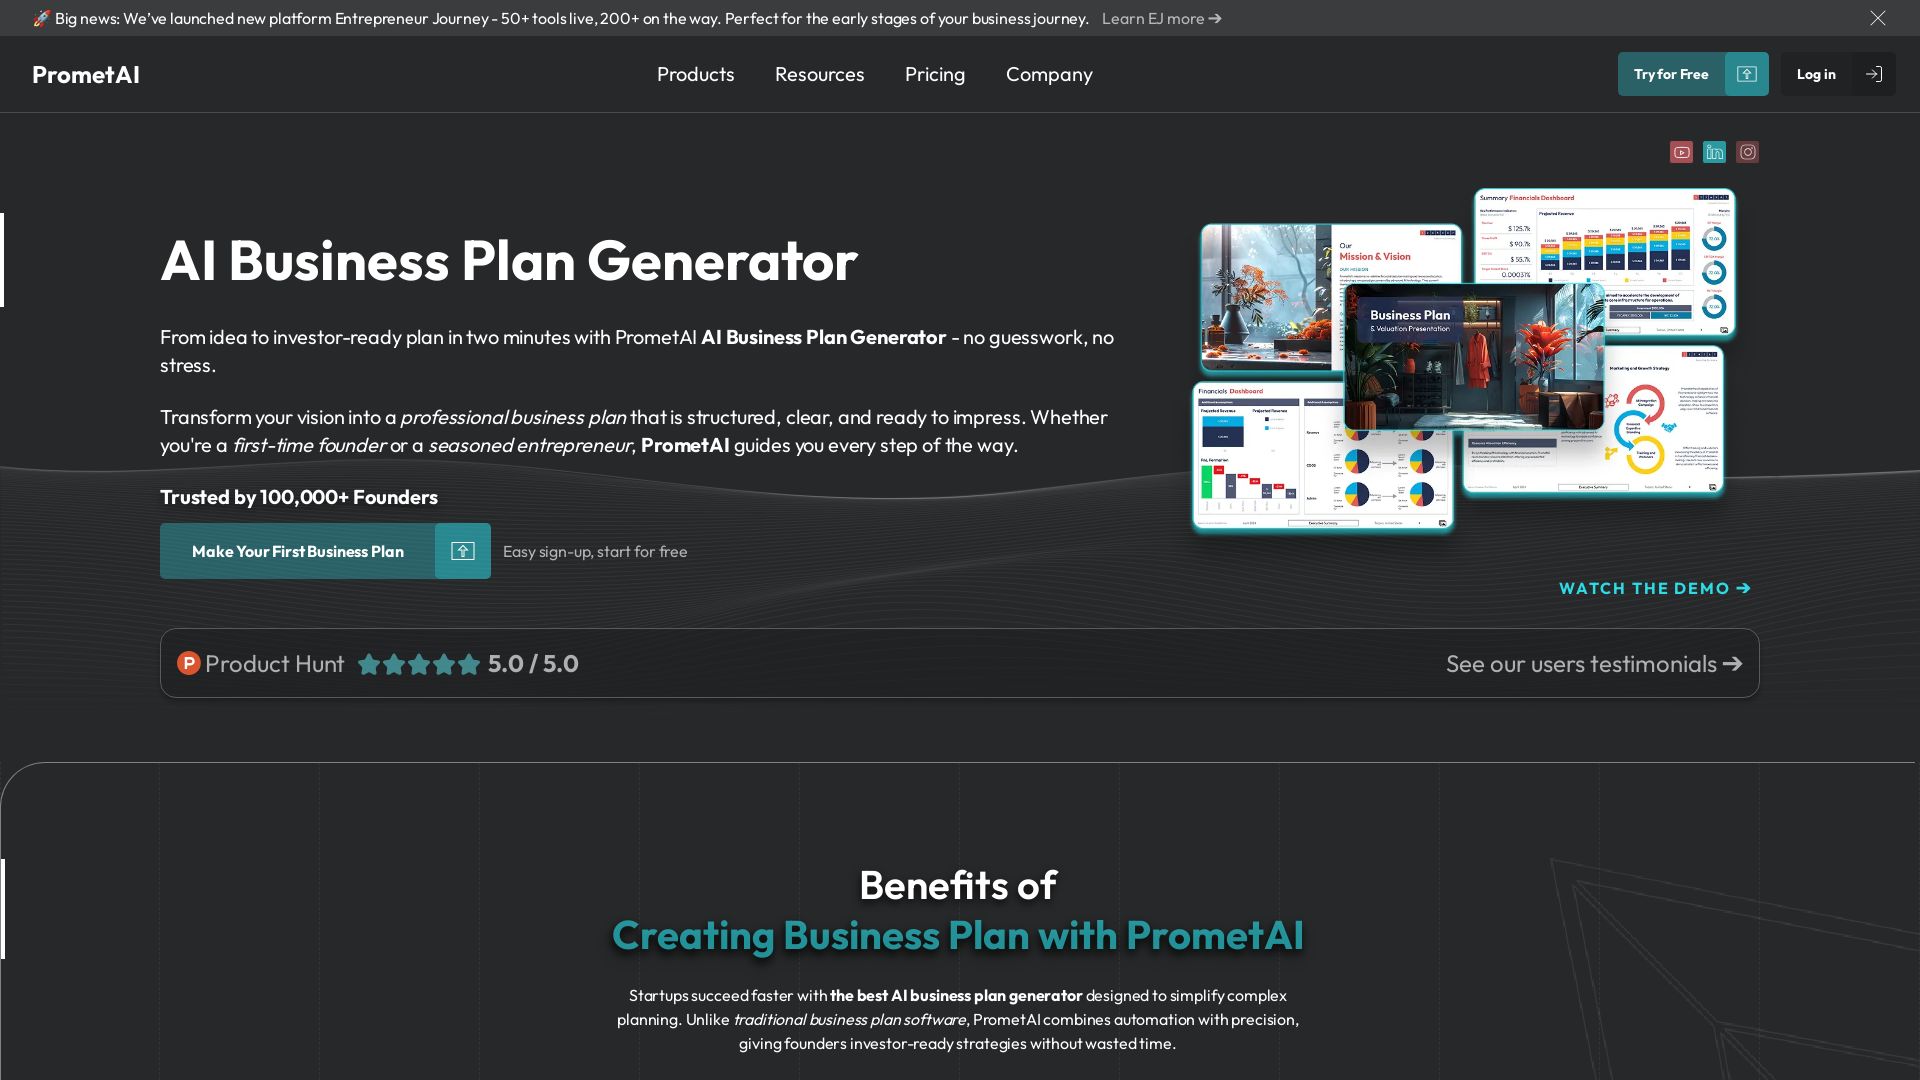
Generate investor-ready business plans in minutes with PrometAI's AI. Trusted by 100,000+ founders. Start for free, no guesswork.

AIGenerator
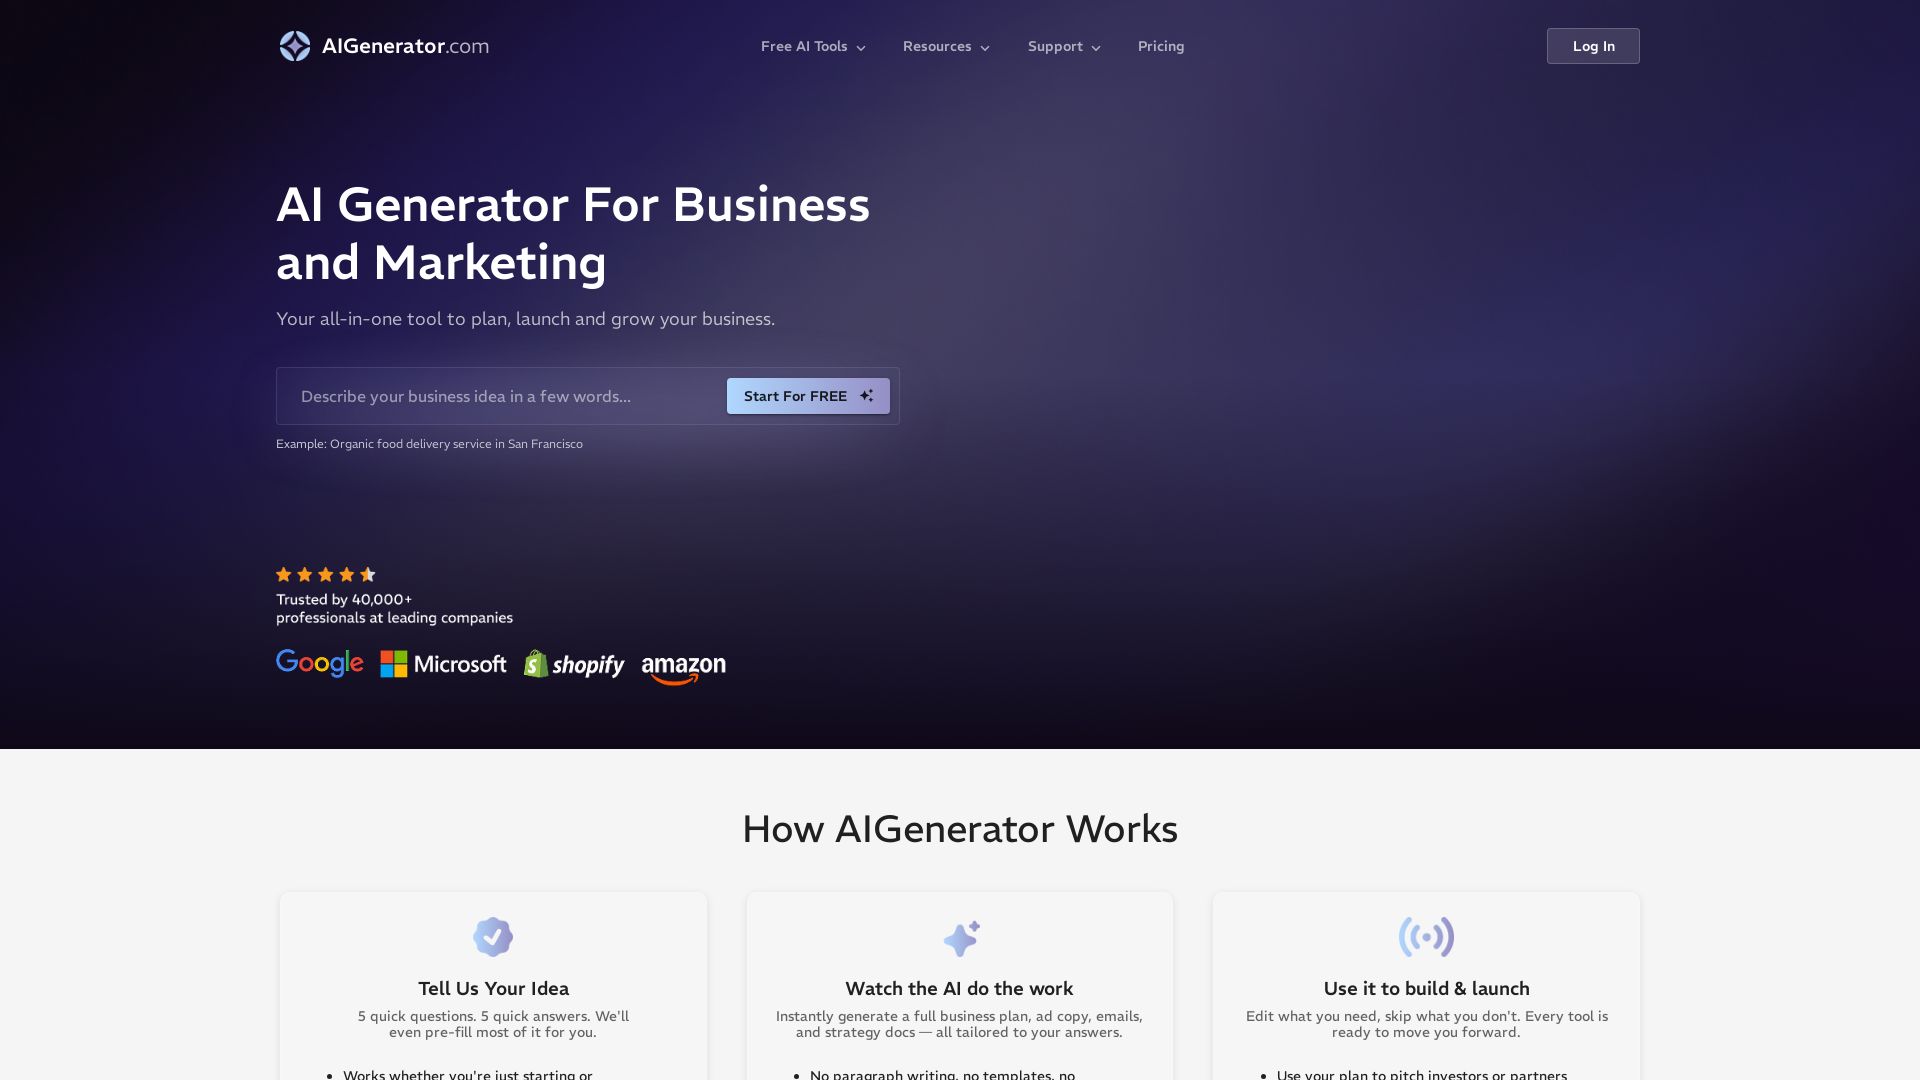
Plan, launch, and grow your business with AI. Generate business plans, ads, and content in minutes. Free to start.


Prezi
Prezi AI creates studio-quality presentations from your ideas. Describe or upload, get a polished deck in seconds. Refine via chat, export as PPTX or PDF. No design skills needed.

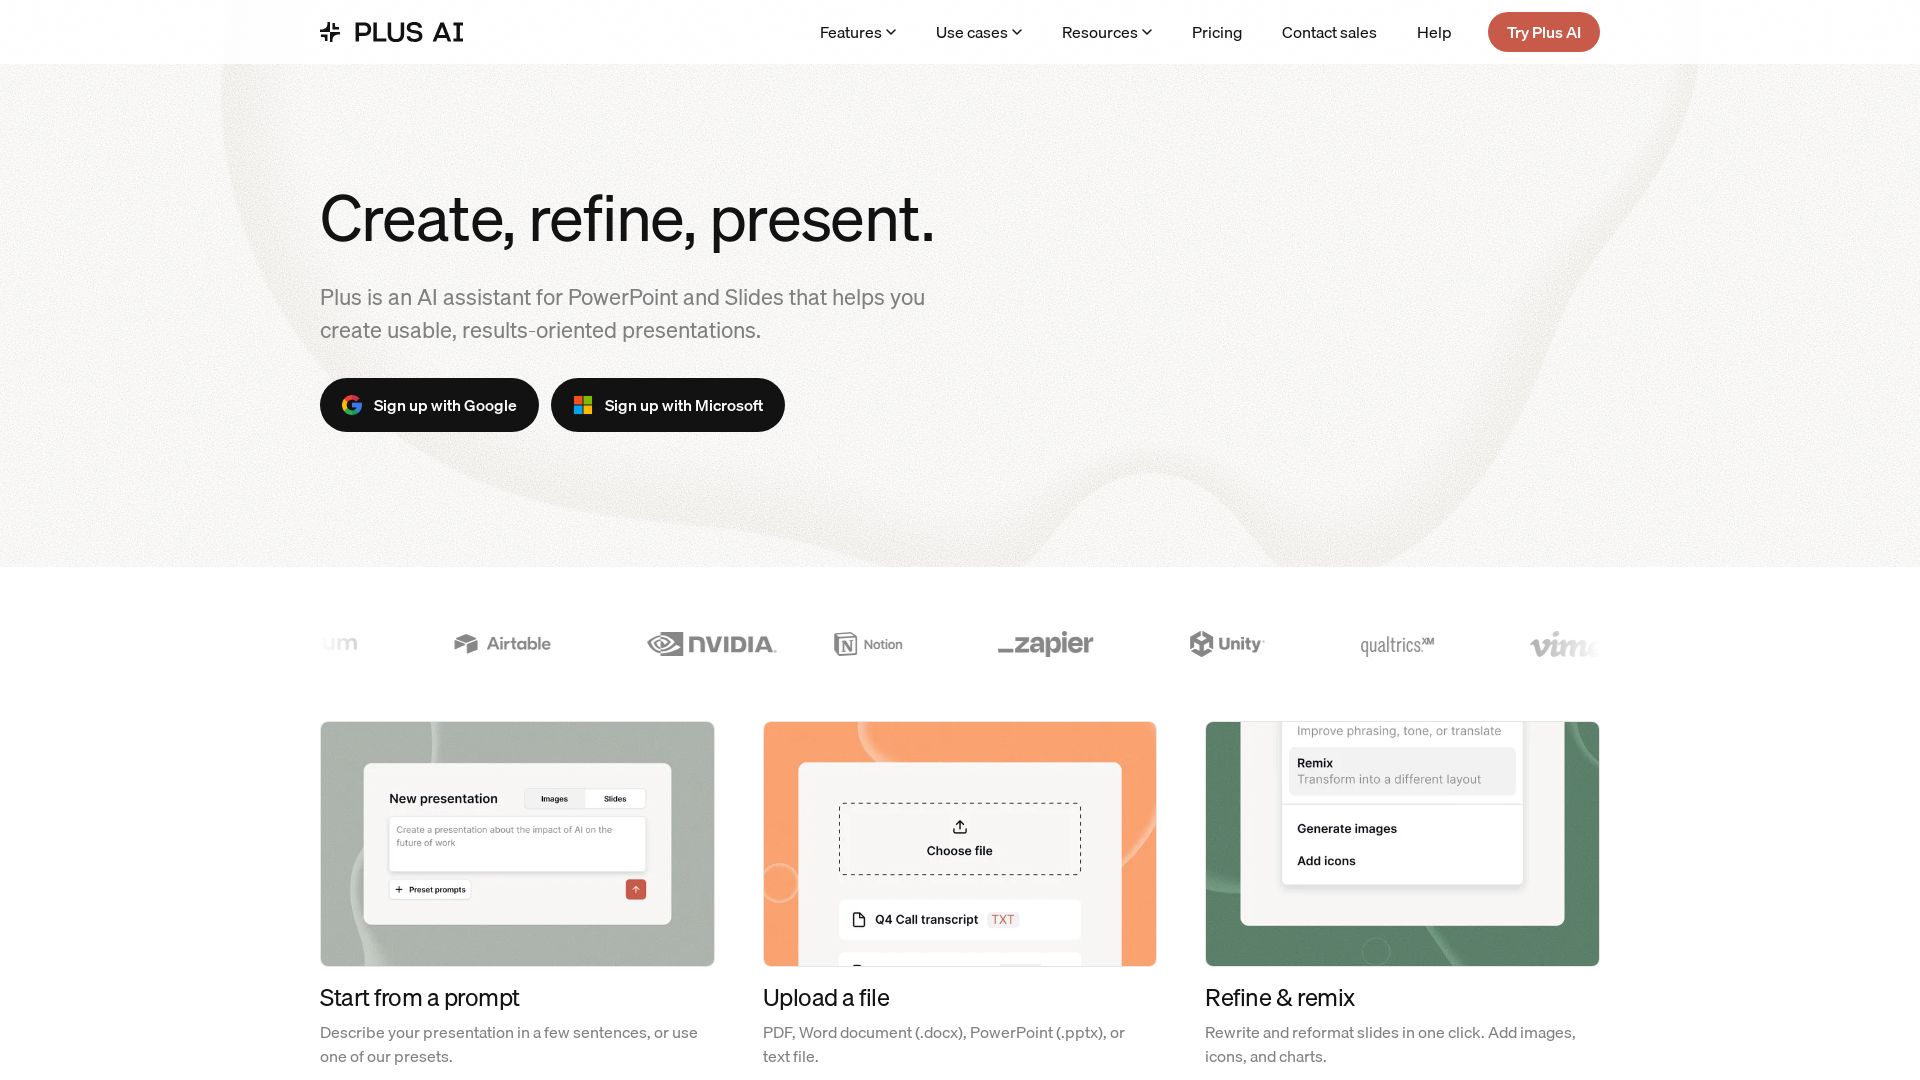
Plus AI
Create beautiful presentations in seconds with Plus AI. Works inside Google Slides and PowerPoint. Generate from prompts, files, or refine existing slides. Includes images, icons, charts. Try free!

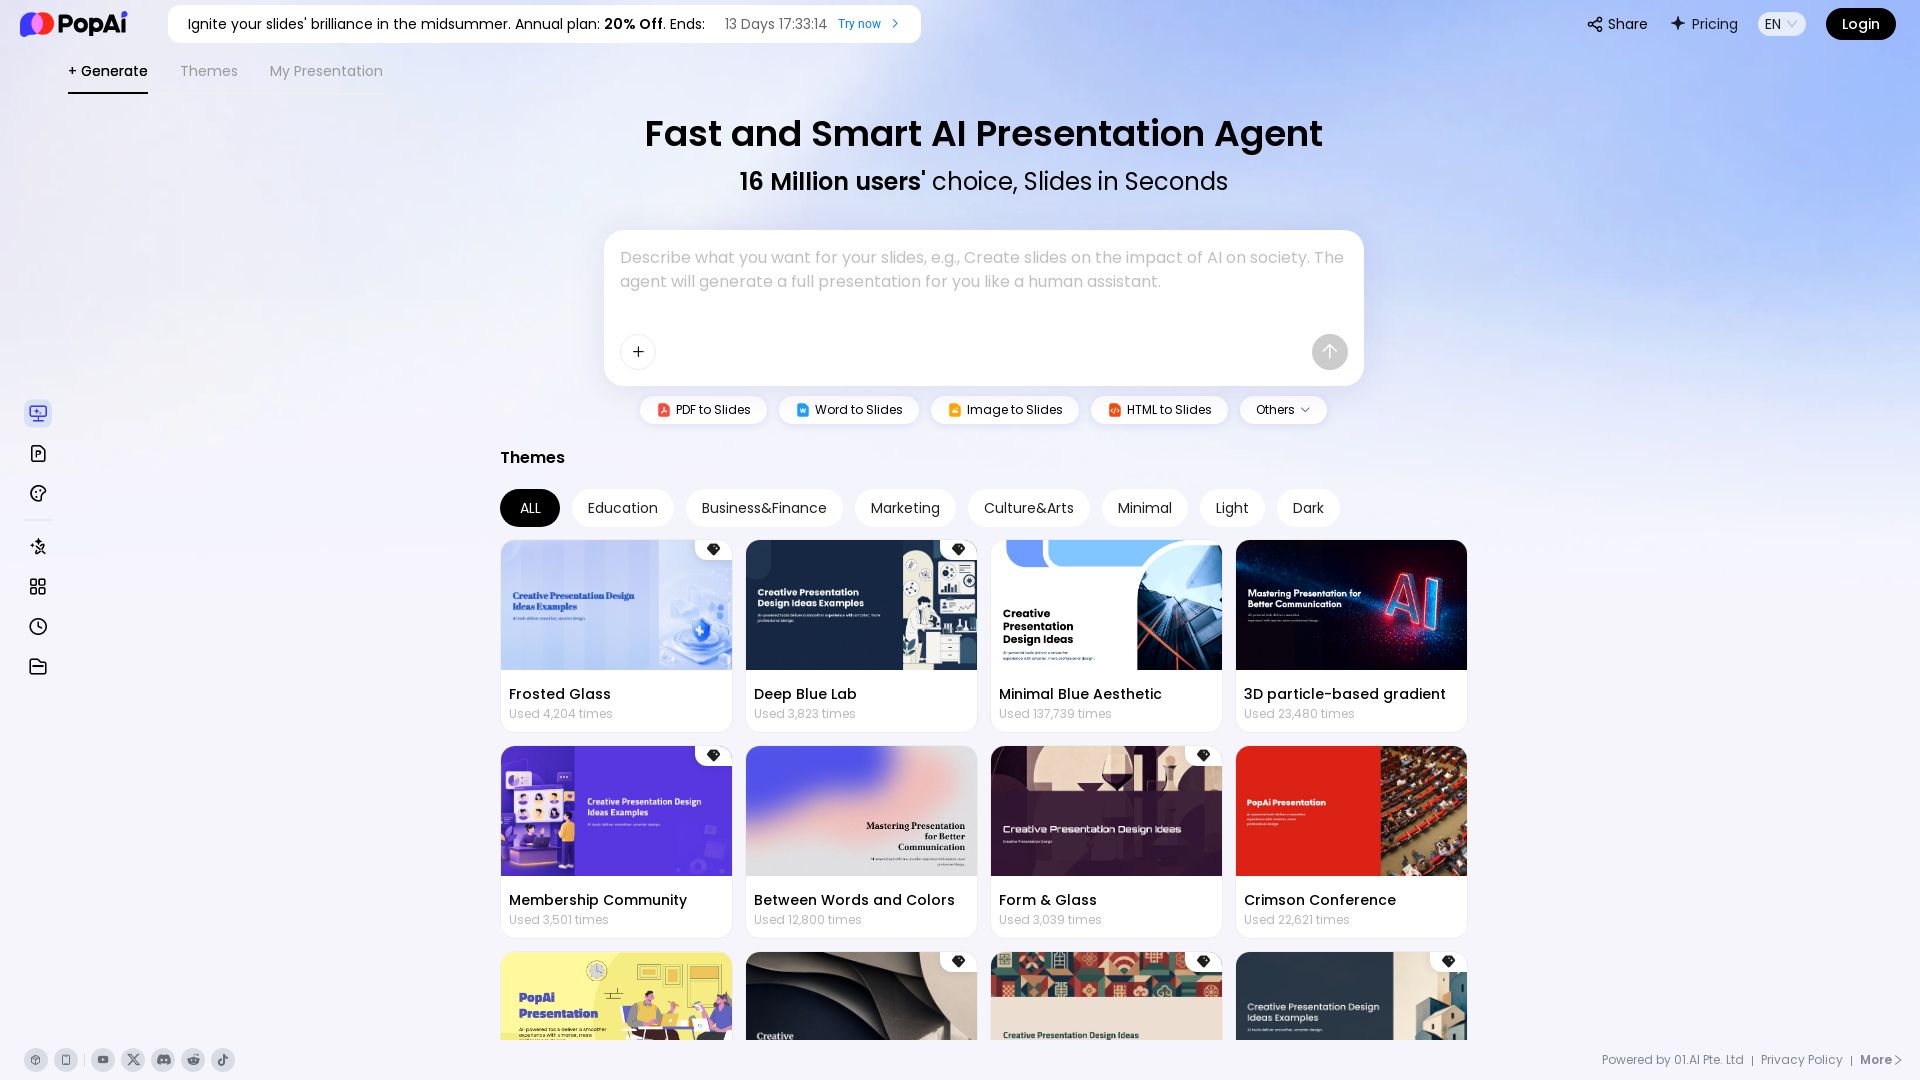
PopAi
Turn prompts, PDFs, Word docs into professional AI presentations. Fast, smart, and easy. 20% off annual plan. Try now!

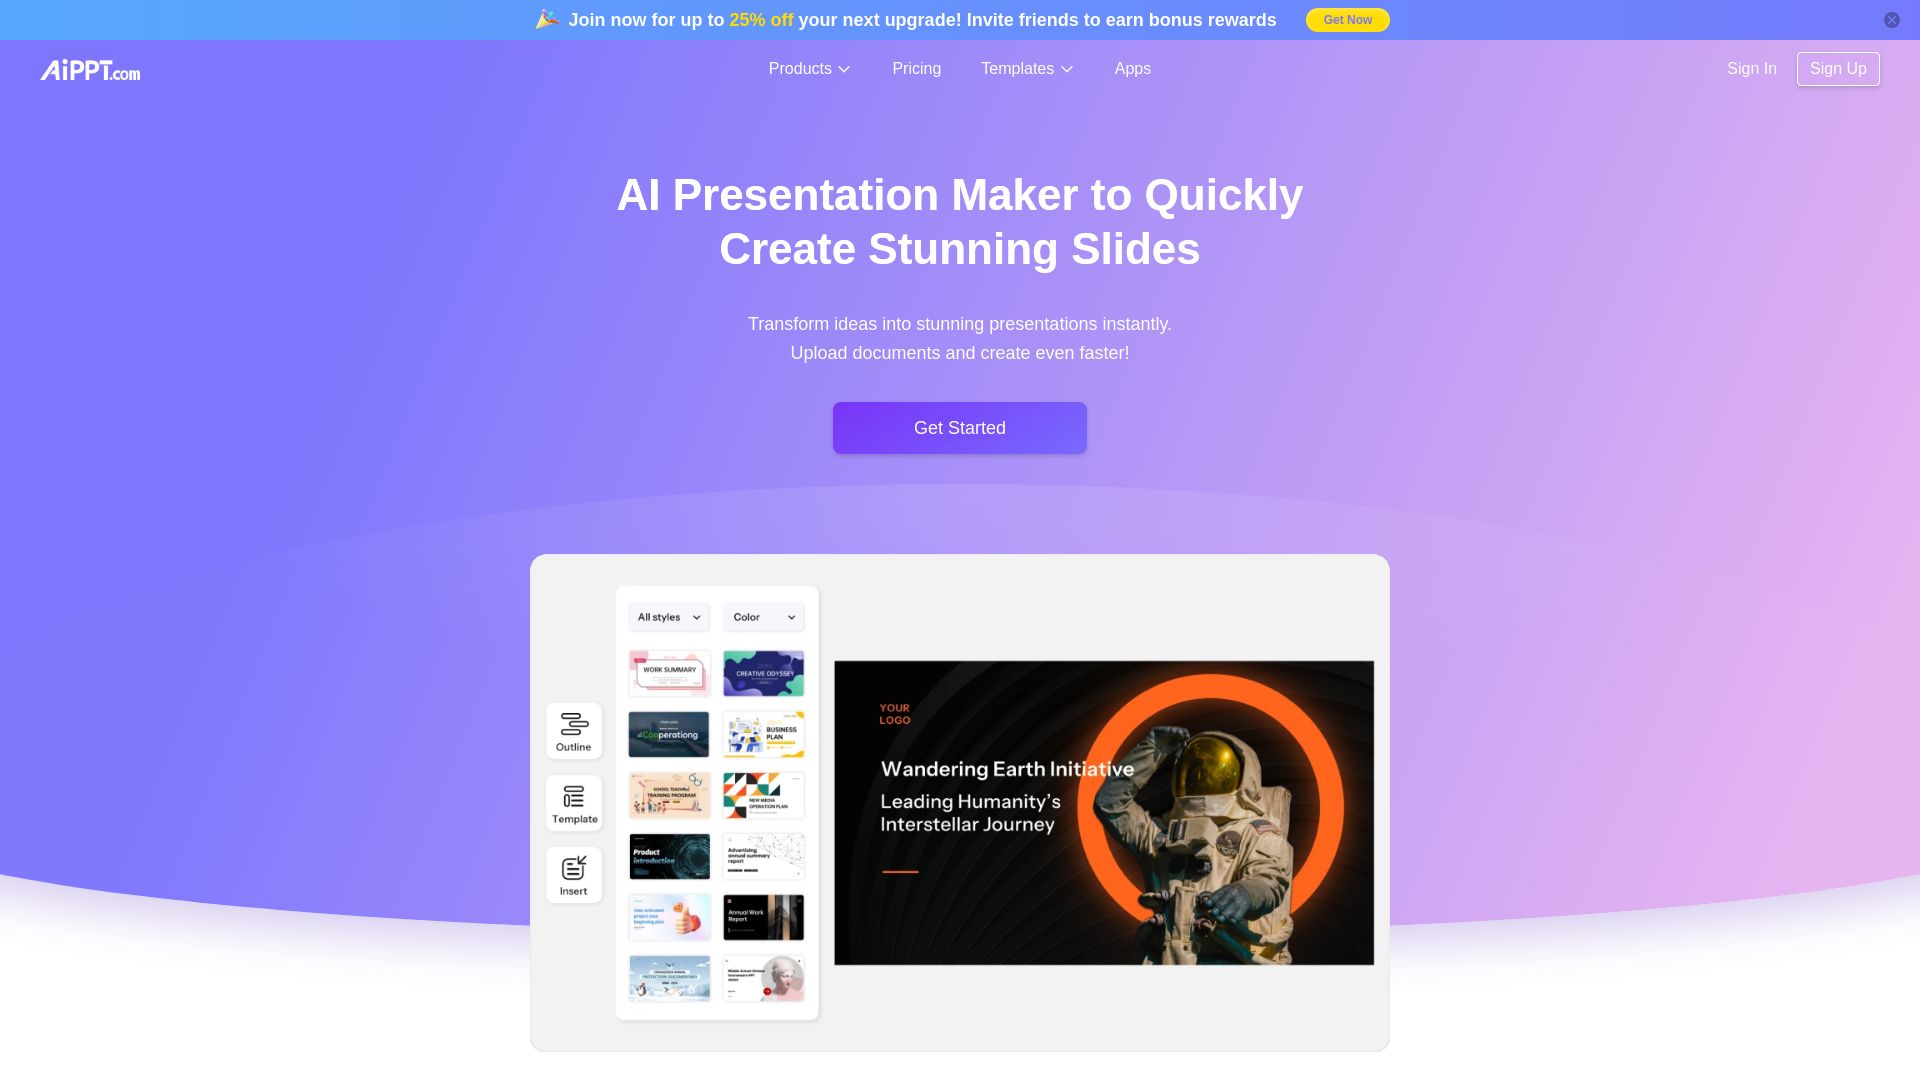
AiPPT
Transform ideas into stunning presentations instantly with AiPPT. Generate slides from text, documents, URLs, or templates. Import from Google Drive. Free and paid plans.

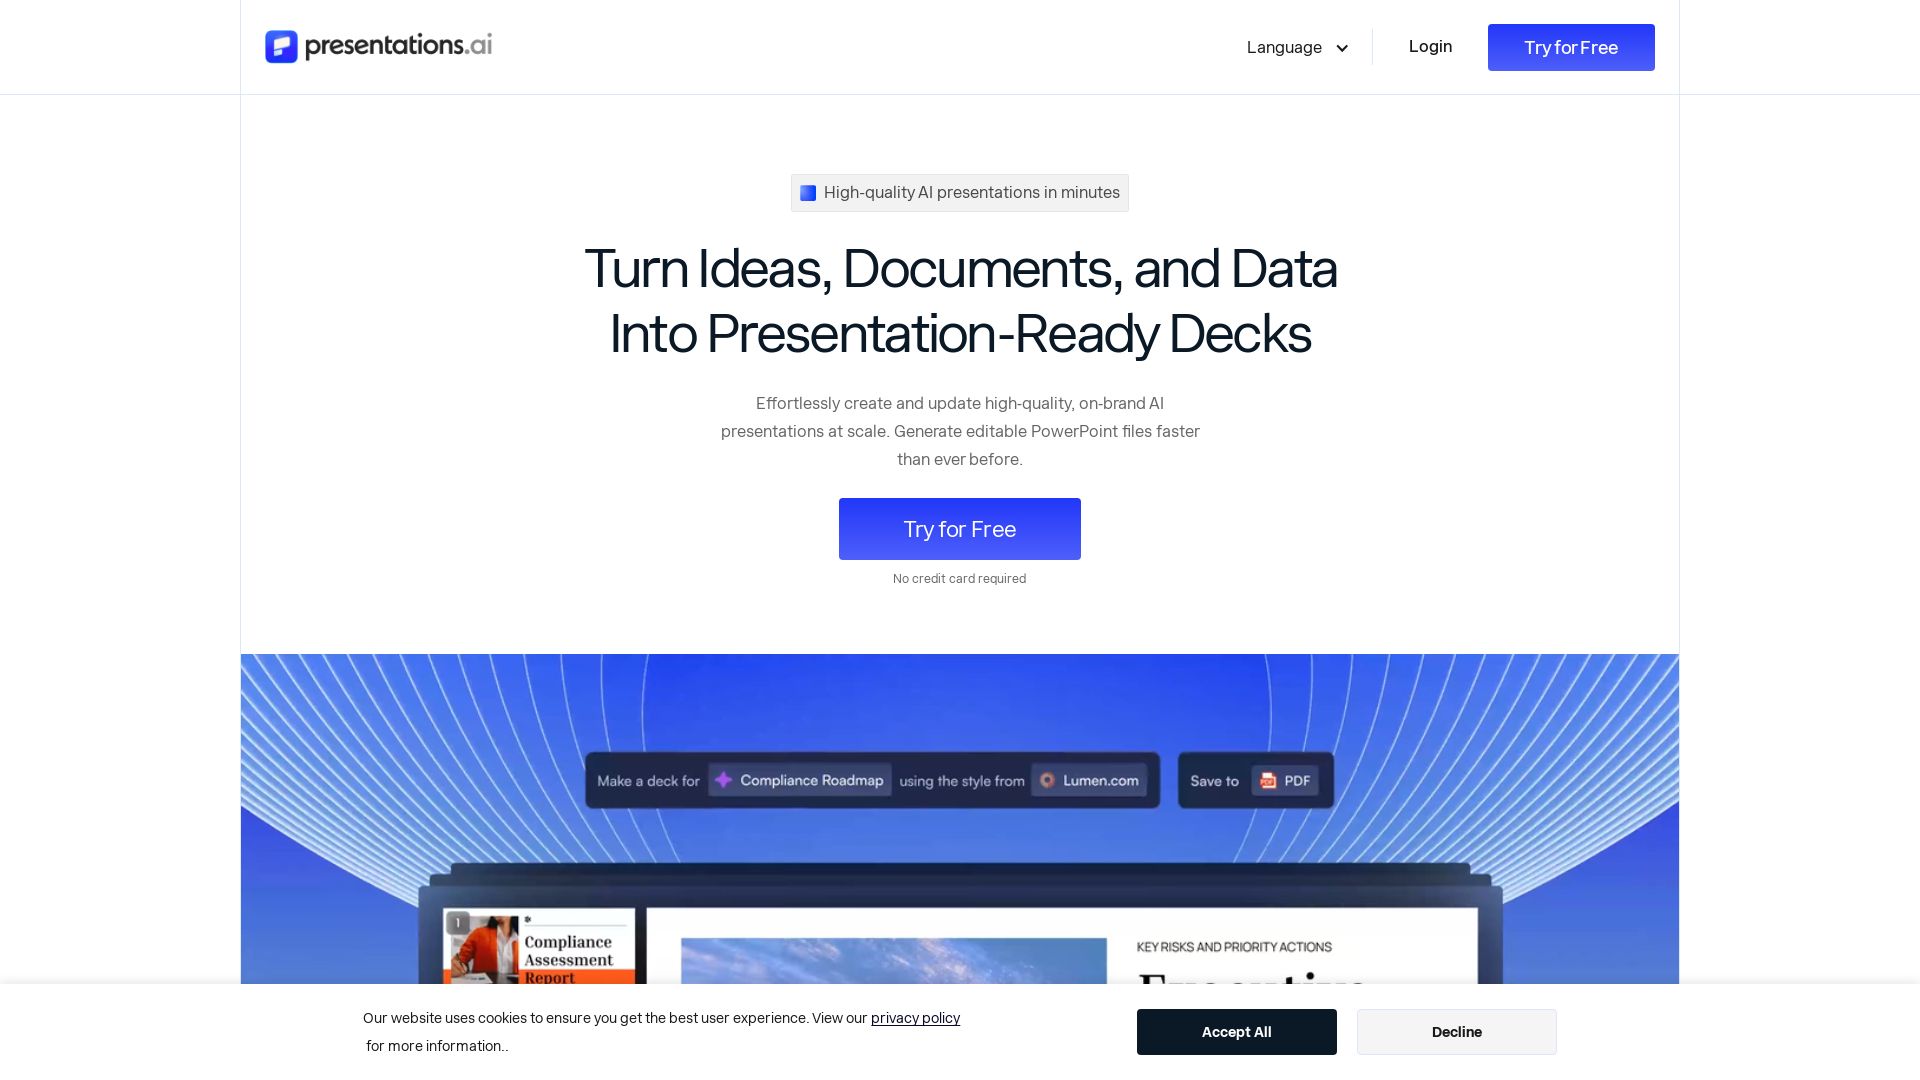
Presentations.AI
Create professional AI presentations in minutes. Turn ideas, documents, or data into editable PowerPoint slides with instant branding. Trusted by 12M+ teams.


Presenti
Turn text, Word, PDF, Markdown & mindmaps into stunning slides in minutes. AI-powered design. 60% off Pro plan – only $8/month. Start free.

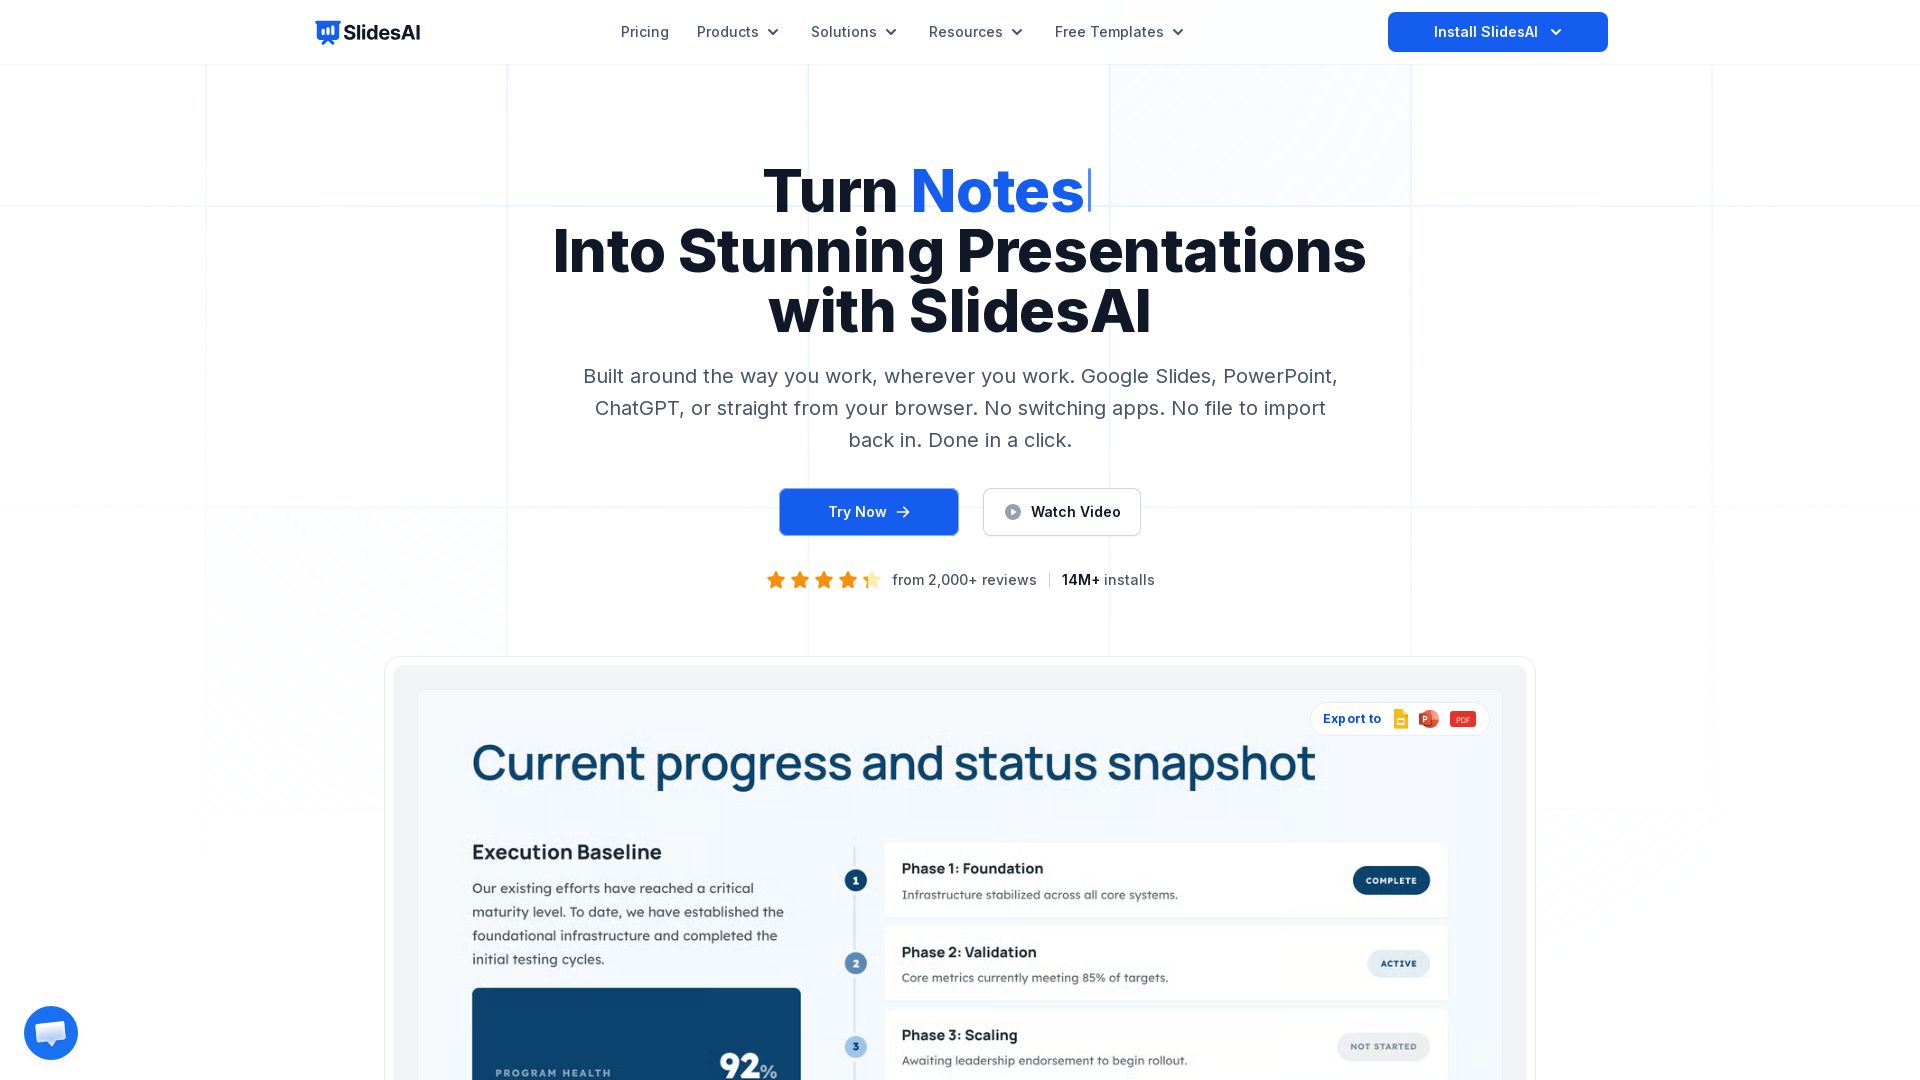
SlidesAI
Create beautiful presentations from notes, prompts, or docs with SlidesAI. Works in Google Slides, PowerPoint, ChatGPT & web. Save 85% time.

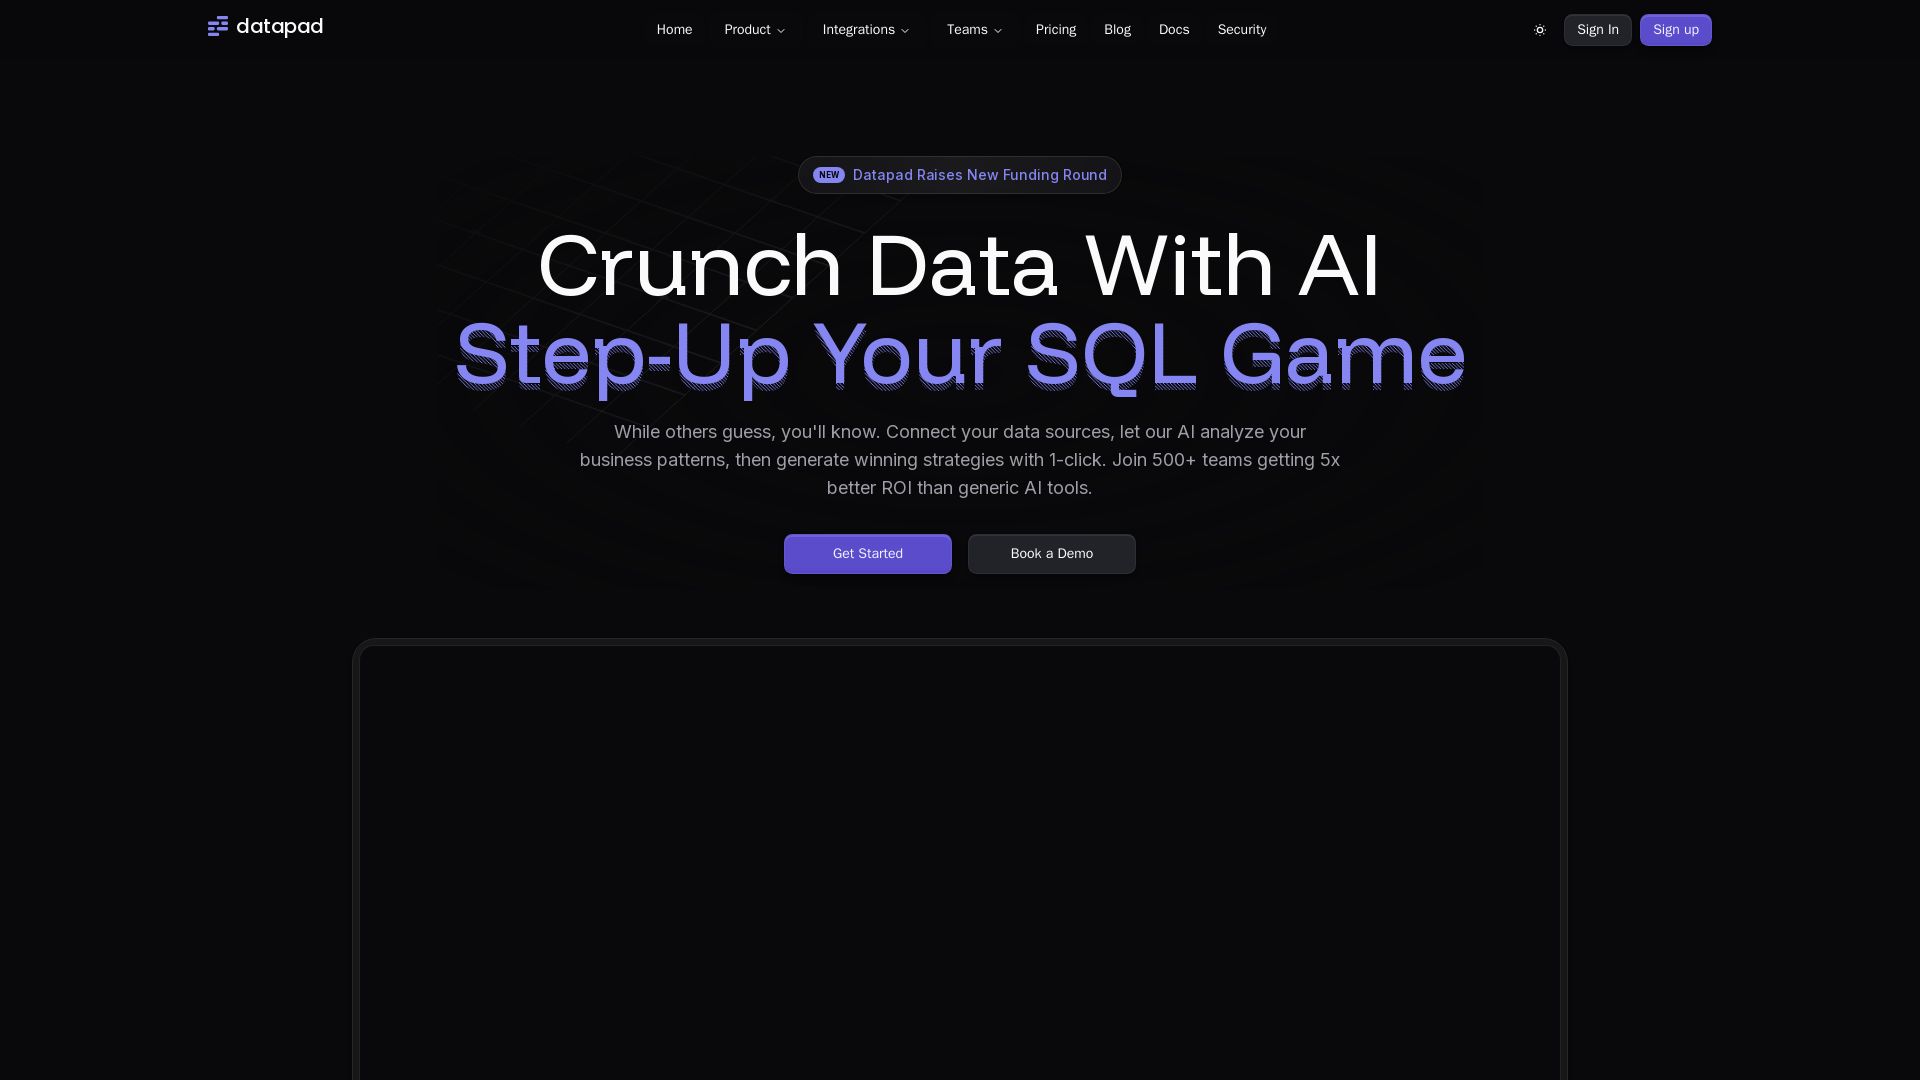
Datapad
Connect any data source, ask questions in plain English. Datapad's AI generates instant insights, dashboards, and strategies. Join 500+ teams getting 5x better ROI.

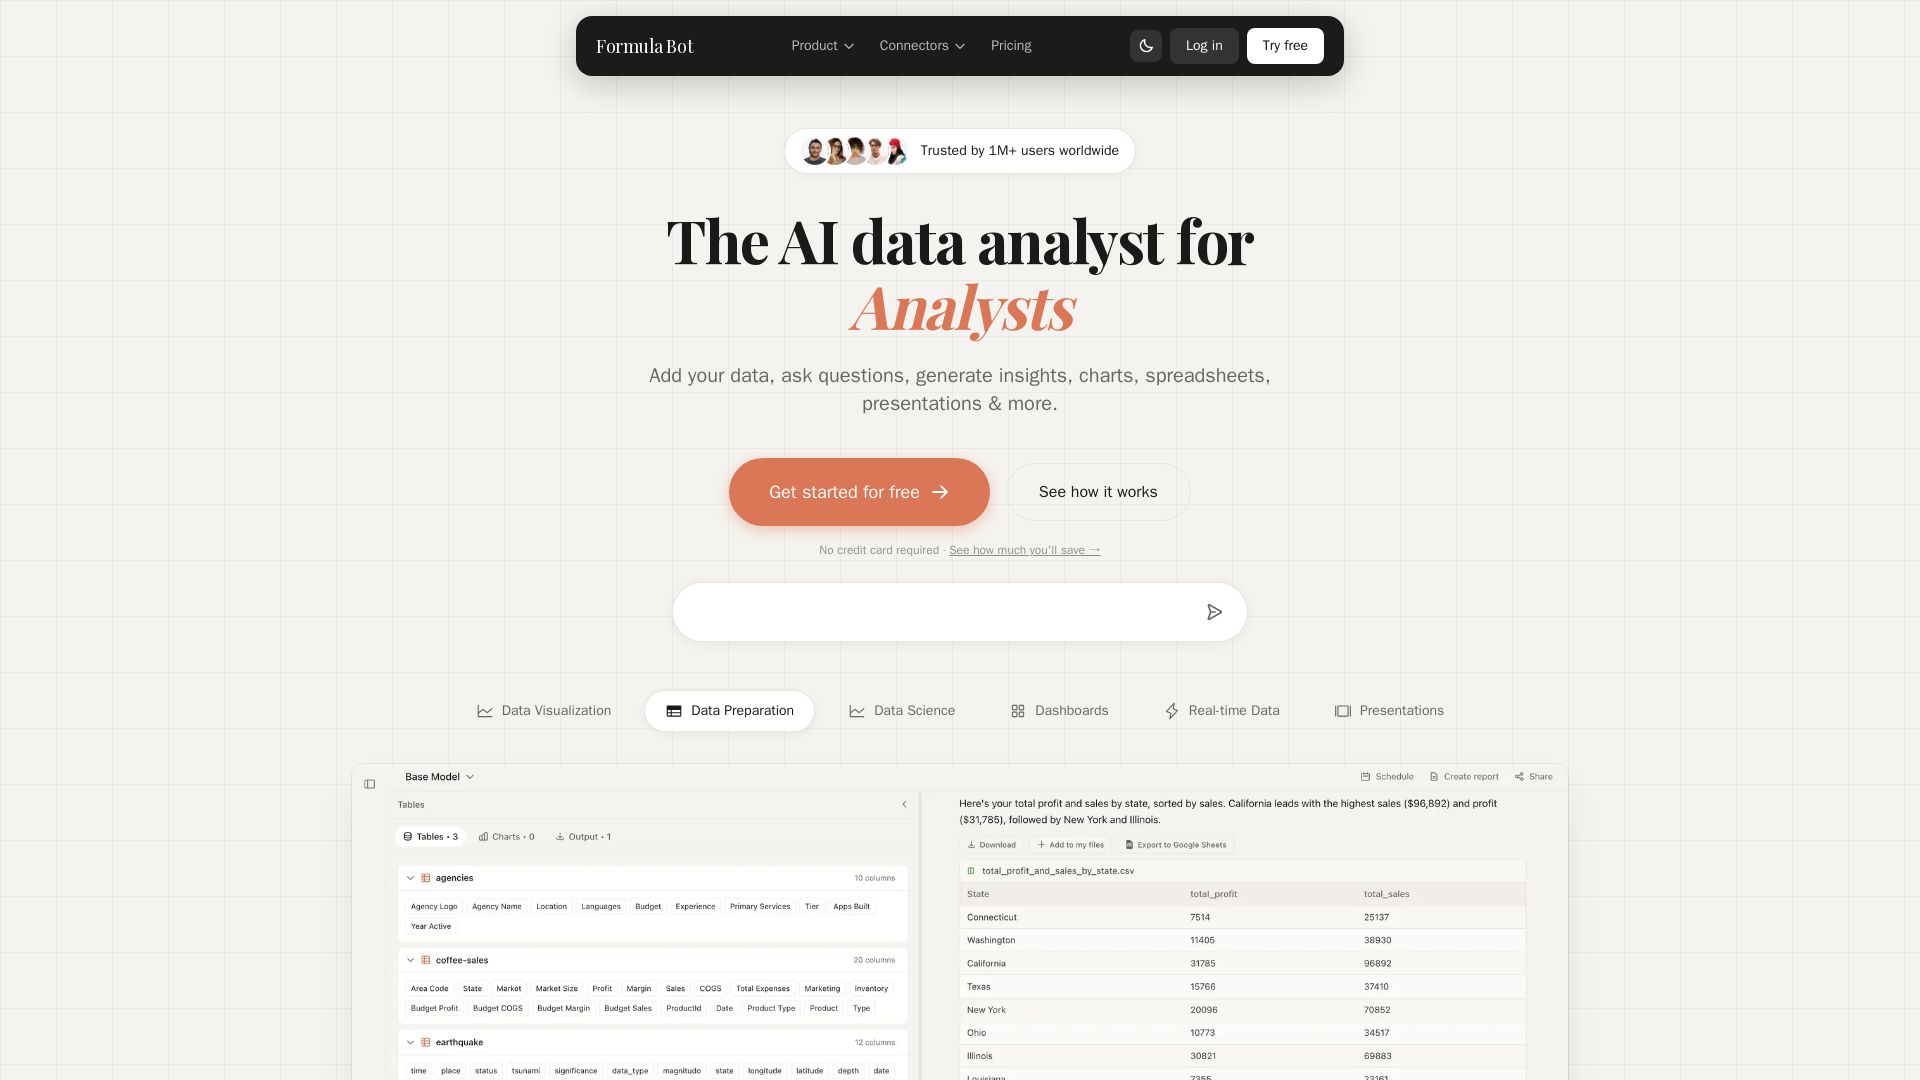
Formula Bot
Add your data, ask questions in plain English, and get instant insights, charts, and dashboards. Free plan available. No credit card required.

ℹ️ Curation Disclosure: The overview and features of ChartGen AI were synthesized using AI and fact-checked by our curation team to ensure accuracy.